How to Collect a Web Performance Trace
Whenever I work with a team that is interested in improving their web product's performance, one of the first things I ask is Have you profiled your web app?.
Collecting a performance trace is one of the best ways to understand how your web app runs on the browser, and will help you identify inefficiencies and bottlenecks.
What is a Trace?
Note: I use the terms Profile and Trace interchangeably.
A Trace (or Profile) allows a developer to "see" their web application executing at runtime via collected stats from the host process, collected by the Profiler.
These stats are aggregated into a structured format that can subsequently be loaded into visualizations, such as Flame Graphs.
The Profiler I use most often is the Chromium F12 Performance Profiler.
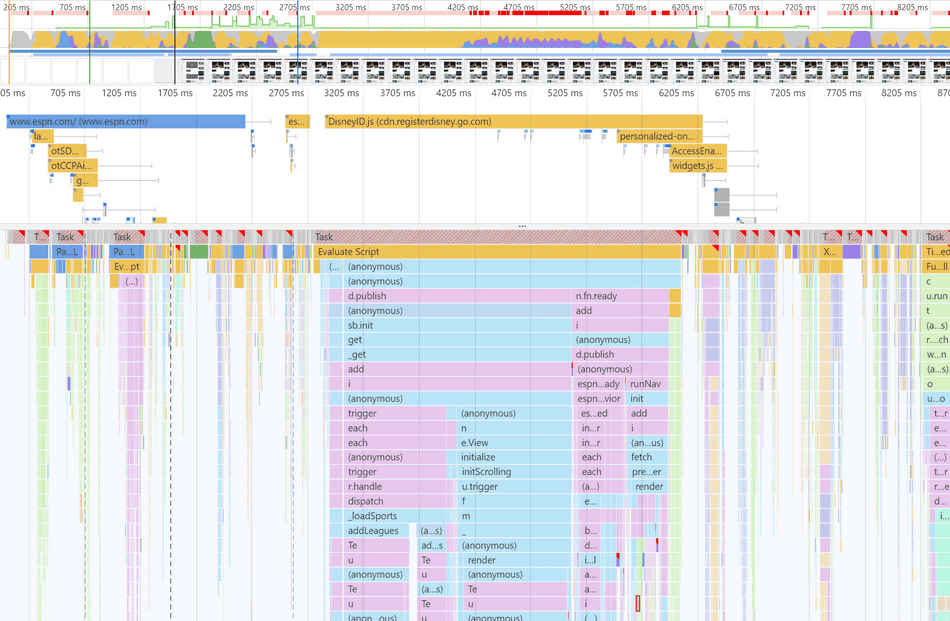
Below is an example visualization generated from the Chromium Profiler:
Opening the Profiler
To open the Chromium F12 Performance Profiler, you will need to use a Chromium-based browser (Chrome or Edge).
Open a browser tab to your web application, and open the Developer Tools via F12, or right-click, Inspect Element.
Once the Developer Tools are open, navigate to the Performance tab.
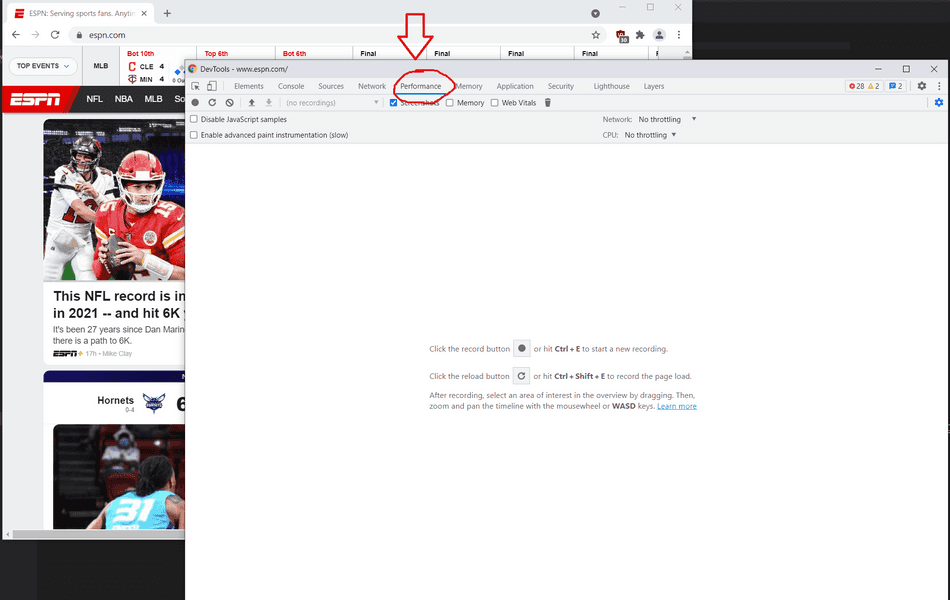
The profiler is associated with the process (i.e. in most cases, the Browser Tab) from which it was opened.
Start Collecting a Trace
Before recording, I recommend always checking the Screenshots option.
To begin collection, click the Record button in the UI.
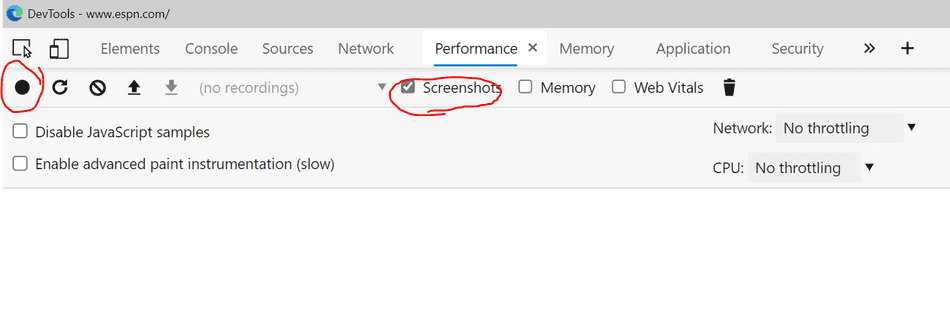
This will begin the tracing of the process.
Capture your Scenario
Once your trace begins collecting, return to your web app in the tab that you originally had opened Chromium DevTools for.
Interactivity Scenarios
Interactive scenarios include:
- Typing
- Clicking or dragging an in-app UI element
- Opening a JavaScript modal or dialog
- Navigating between routes of your JavaScript SPA (these are not the same as full page load scenarios)
These are straightforward to capture; just go ahead and enact the scenario while the profiler is recording.
Page Loads
For full page load scenarios, I recommend navigating to about:blank before starting the collection of your profile.
This will ensure you don't capture any extraneous unload JavaScript event handlers, and your trace
is more representative of your actual user scenario when navigating to your web app.
To be clear:
- Open the F12 Chromium Profiler
- Navigate the tab to
about:blank - Begin recording in the Profiler
- Navigate to the page you want to profile
- Let the page fully load
End Recording
Once you have finished enacting your scenario, click Stop in the Profiler.

It will populate the Profiler UI with the collected results of your scenario.
Exporting a Trace
Exporting a trace can be handy to share your collection with other engineers for team analysis.
To export a trace, in the Profiler UI, select Save Profile...:
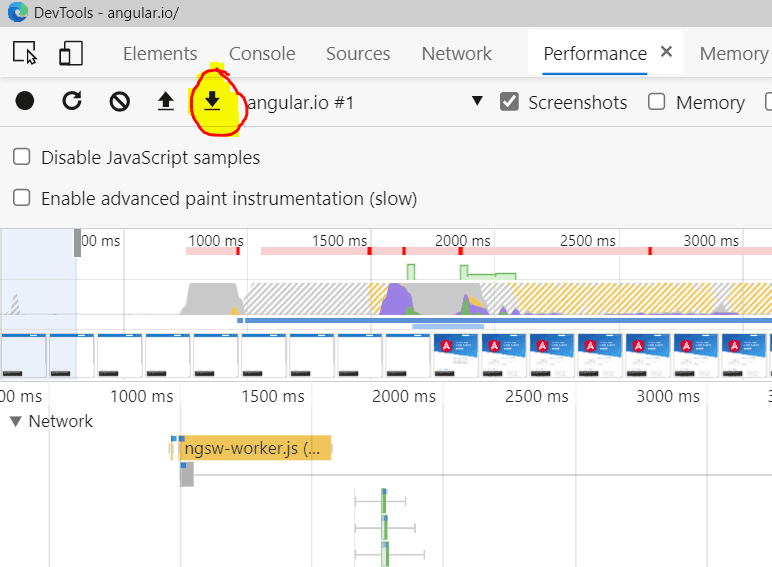
This will produce a .json file. Save it anywhere.
These .json traces are easy to share amongst team members for investigation into performance issues.
Importing a Trace
If you want to revisit a previously collected trace or import a trace from a team member, select the Load Profile... button:
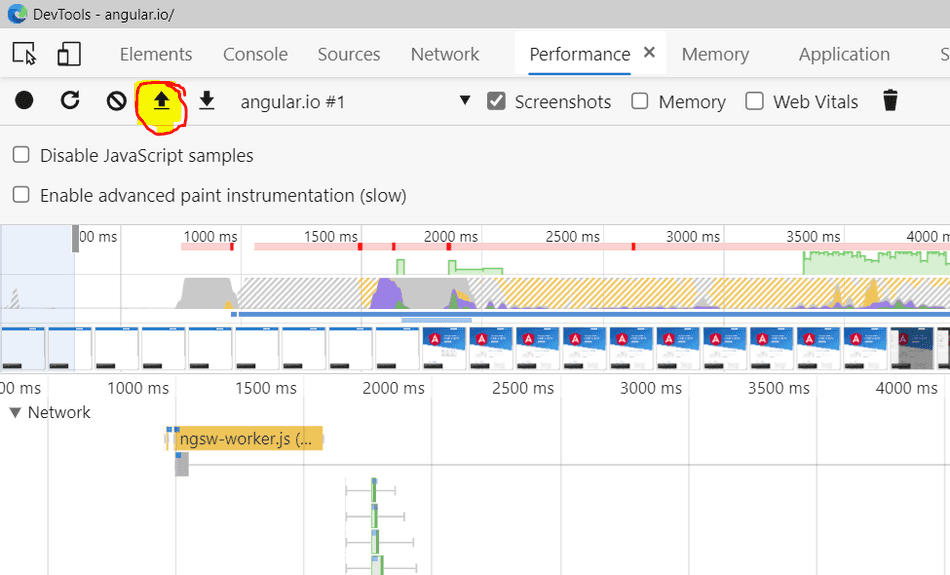
Select a compatible .json file and it will load up in the UI.
Conclusion
You now have the knowledge on how to start profiling your web application!
Start exploring the Profiler UI:
That's all for this tip! Thanks for reading! Discover more similar tips matching Beginner and Profiler.

