A Basic Overview of the Chromium F12 Performance Profiler
The Chromium Performance Profiler's UI can appear overwhelming at first, but it is actually quite intuitive once you understand how it's setup.
In this tip, I'll walk you through the basic components of the Chromium F12 Profiler's UI, so you can start identifying performance bottlenecks on your web app!
Prerequisite
You should collect a trace and ensure it's loaded up in the Chromium Profiler.
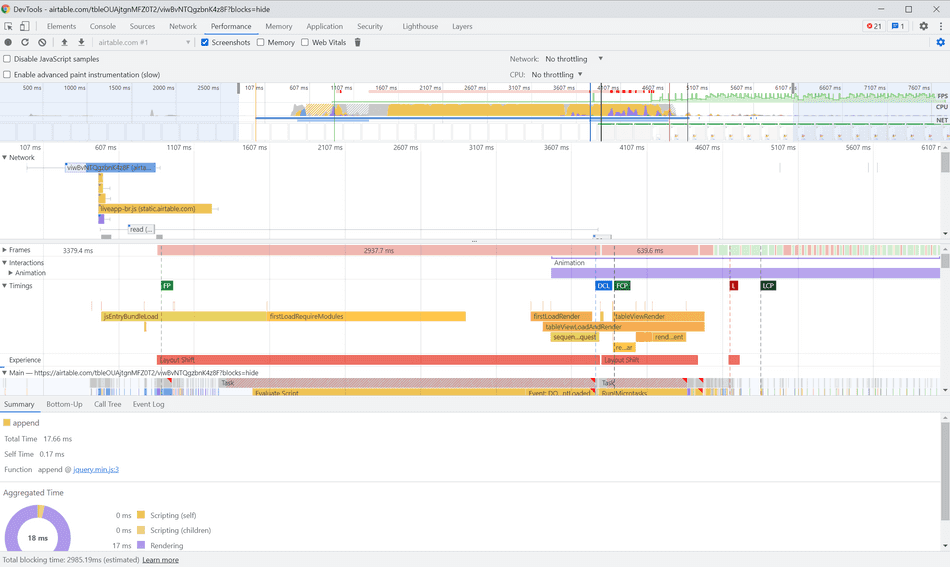
The loaded profile I'm using in this article looks like this:
Layout
There are three primary sections:
- Trace Overview
- Selection Analysis Pane
- Details Bottom Pane
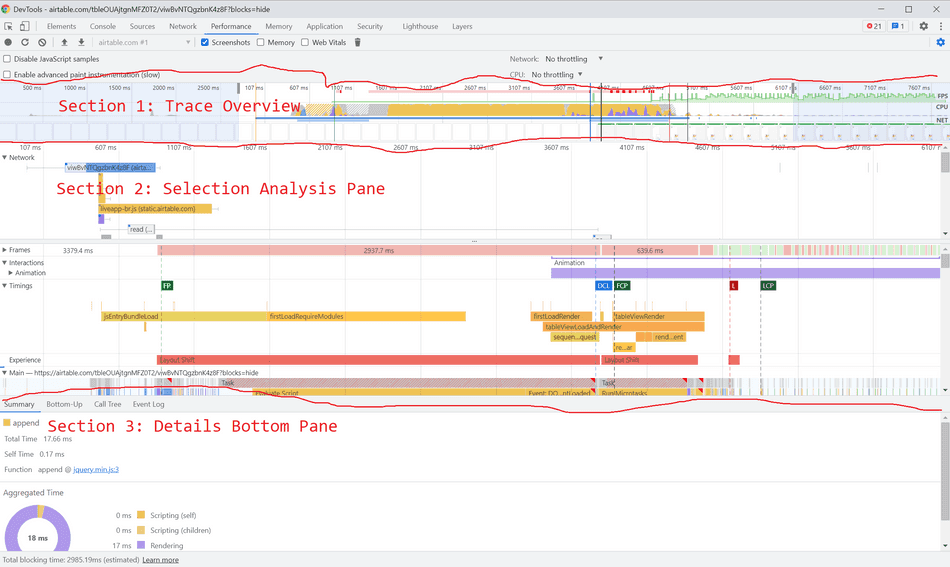
Section 1: Trace Overview
I think about this section as an "Overworld Map" or "minimap" of the entire captured profile.
Regardless of the duration of the collected profile, the entire profile will fit in this top section.
It provides at a glance visualizations that you can use to Select or Zoom in to in the Selection Analysis Pane for deeper analysis.
Timestamps
In the Profiler UI, time is represented from left to right, meaning the left-most portion of the trace represents the beginning of the collection and subsequent captured events are filled in to the right as time passes.
One thing that can be initially confusing is the timestamps both above and below this section.

The timestamps that are used for the Trace Overview are the timestamps at the top (circled in Red above). These timestamps will span the entire duration of your trace collection.
The timestamps in Blue are related to the Selection Analysis Pane, and are driven by Selection.
Selection
In order to get more details specific sections of the captured trace, we need to use Selection (or Zooming).
Click and drag in the Trace Overview section in an area of interest:
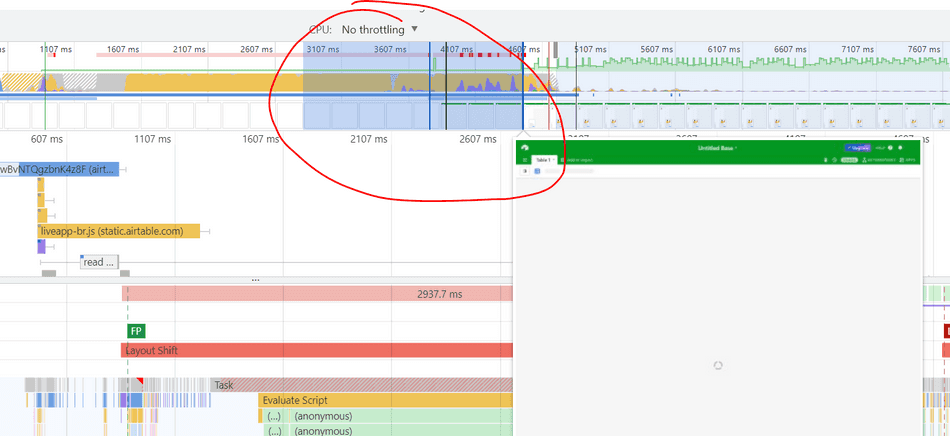
This will scope the Selection Analysis pane to only the area you've just selected. Notice the timestamps below (circled in Blue) change to reflect the section you've selected:

You can also use the Mouse Wheel, WSAD keys, or Click-and-Drag in the Selection Analysis Pane to adjust your Selection / Zoom area.
Screenshot Preview
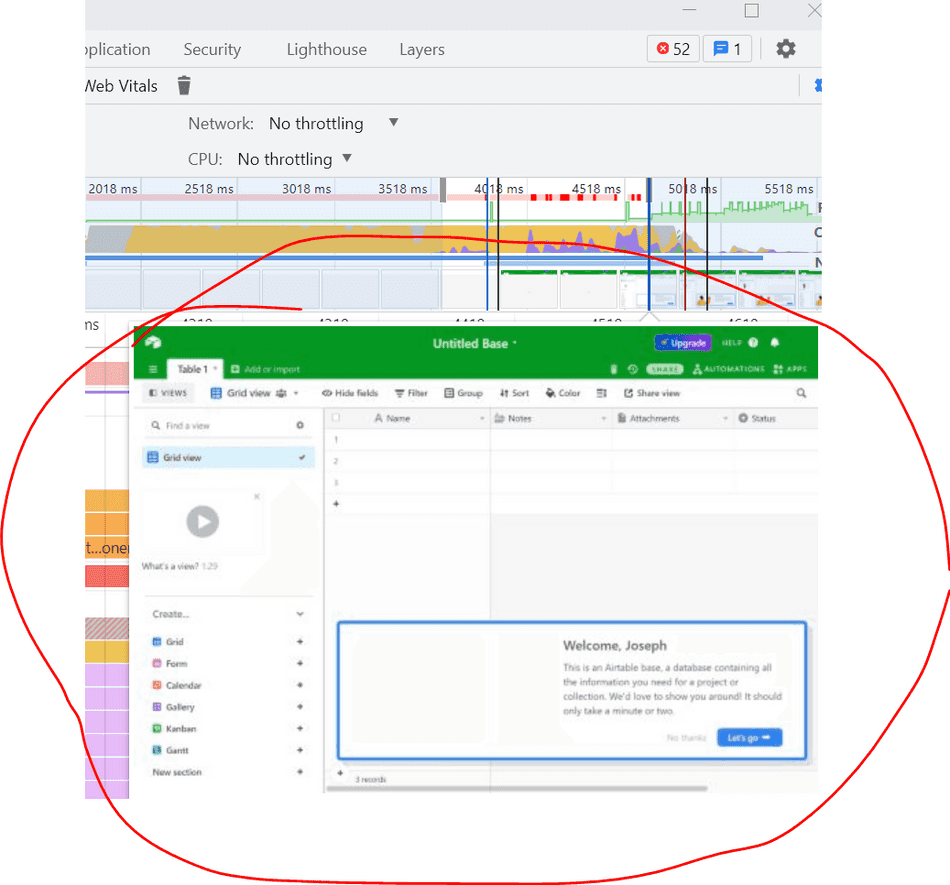
If you enabled screenshots during your trace collection (which I always recommend!) you should see a UI preview as you hover over the Trace Overview section.
This is particularly helpful if you want to scope a selection to a specific visual scenario.
For example, you may want to select the portion of time between the user clicking a button and a modal appearing on the screen to see what the CPU and Network were doing in that block of time between those events happening.
Section 2: Selection Analysis Pane
This is the most complex section of the Profiler, and also where I spend most of my time analyzing profiles.
This pane is scoped to whatever the selection you've set in the Trace Overview section. It will always fit the entirety of where you've selected.
Sub-panes
This UI has multiple sub-panes that can be collapsed or expanded.
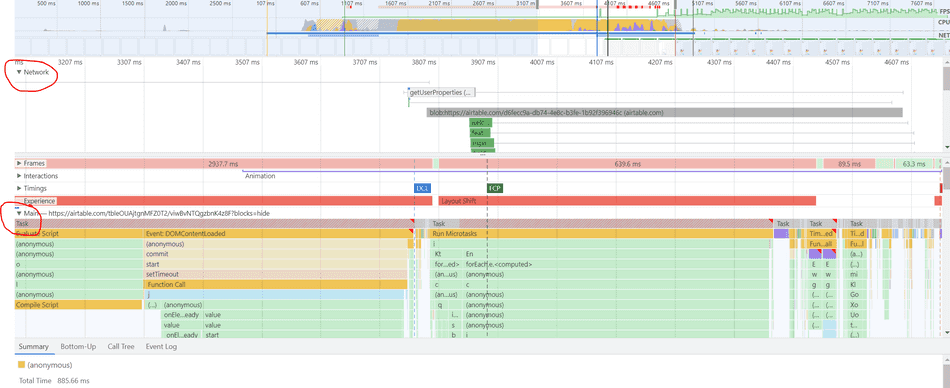
For beginners, I recommend expanding only the Main and Network tab, while collapsing the rest:
Network Sub-pane
The Network sub-pane shows all networking activity within your selection.
You can inspect the type, order, and durations of network requests made in the time slice of your selection.

For details on how to read this pane, see my detailed tip on the Chromium Profiler Network Pane.
Main Sub-pane
The Main sub-pane refers to the Main UI thread of your web application.
All CPU activity taking place on the Main UI thread is recorded here as Tasks.

CPU activity can include, but is not limited to:
- Parsing of HTML
- Execution and compilation of JavaScript
- Handling User Input such as Clicks and Keypress events
- Style, Layout, and Paint, used to prepare for generation of pixels / frames
For details on how to read this pane, see my detailed tip on the Chromium Profiler Main Thread Pane.
Other panes
Other helpful panes include:
- Frames - a representation of frames generated to the screen over time
- Timings - custom markers web developers can place to help measure and annotate profiles
- WebWorker or ServiceWorker threads - other JavaScript execution threads
- Compositor - activity for compositing graphical layers and preparing frame generation
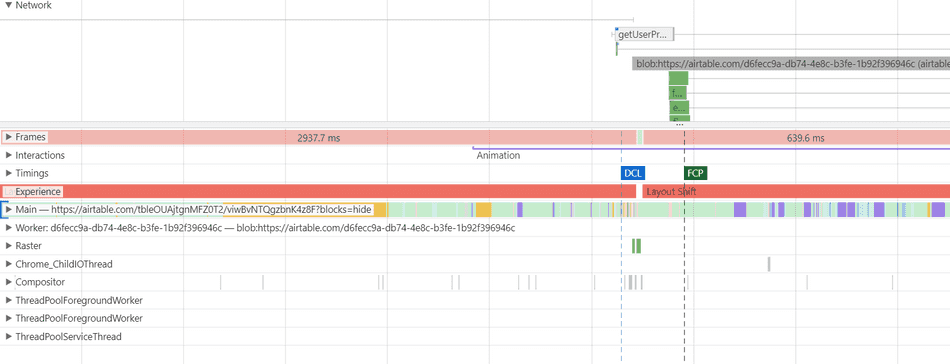
These are covered in my detailed tip on advanced profiler UI.
Section 3: Details Bottom Pane
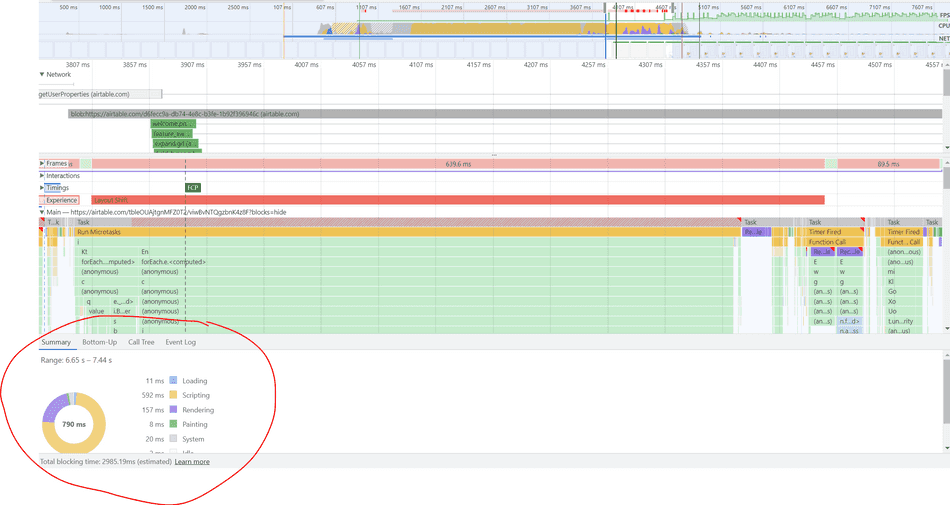
At the bottom of the page, there's a Details Pane. Similar to the Selection Analysis pane, the statistics shared in this UI are scoped to the selection in the Trace Overview:
Summary Tab
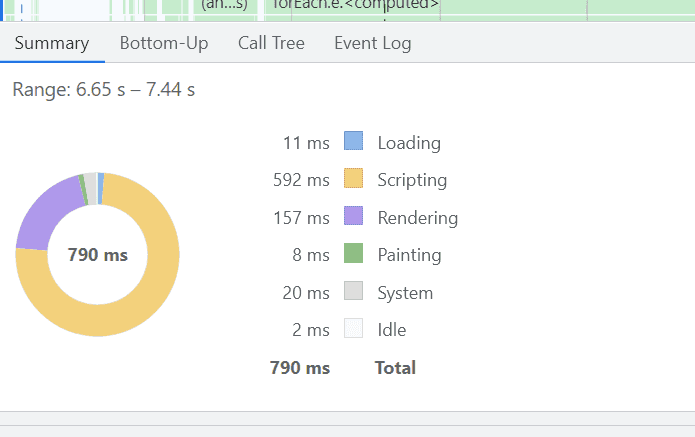
The Summary Tab provides stats on what type of CPU activity is consuming your main thread:
In this example, within the 790ms selection, 592ms is being spent on JavaScript activity:
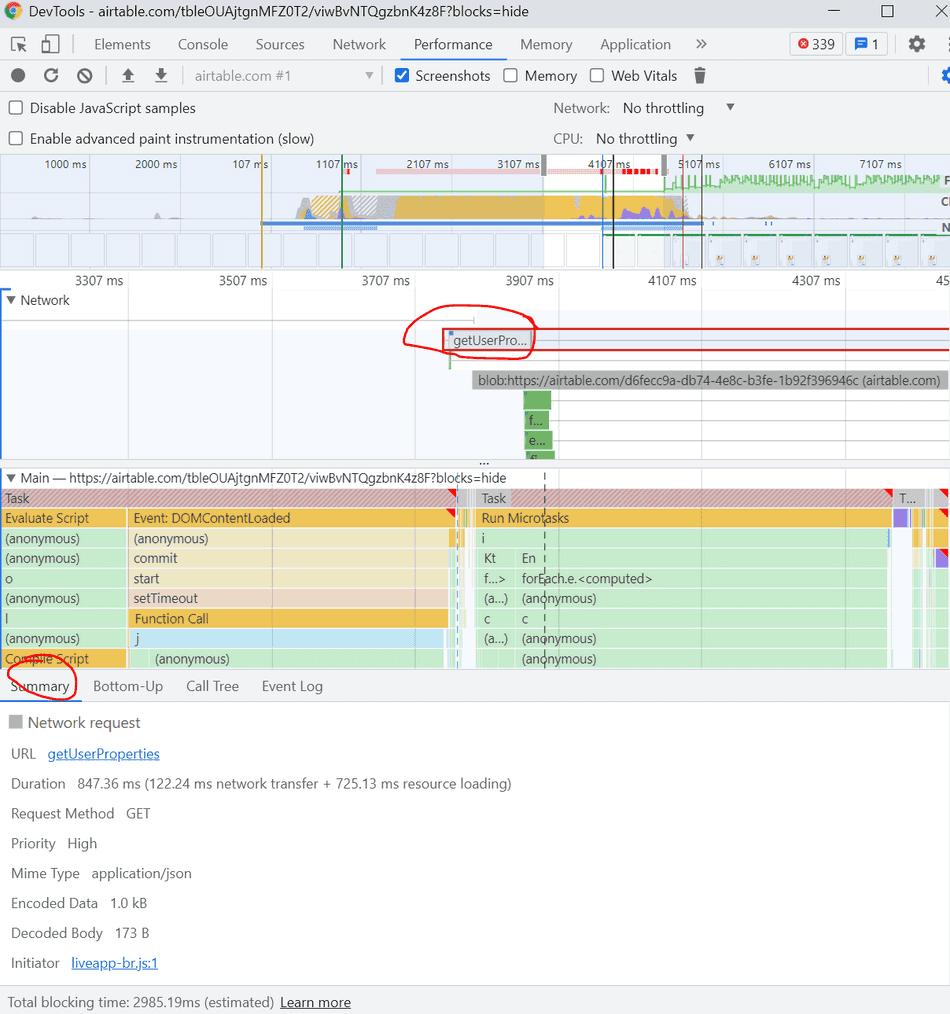
It should be noted that the Summary tab adapts to what entity is selected.
For example, if you select a network request, it will provide a summary of the network resource:
Bottom Up Tab
The Bottom Up tab provides information on time spent for various CPU / JavaScript activities within a selection from a reverse callstack perspective.
For example, if function a() calls function b(), b's time to execute is shown on top:
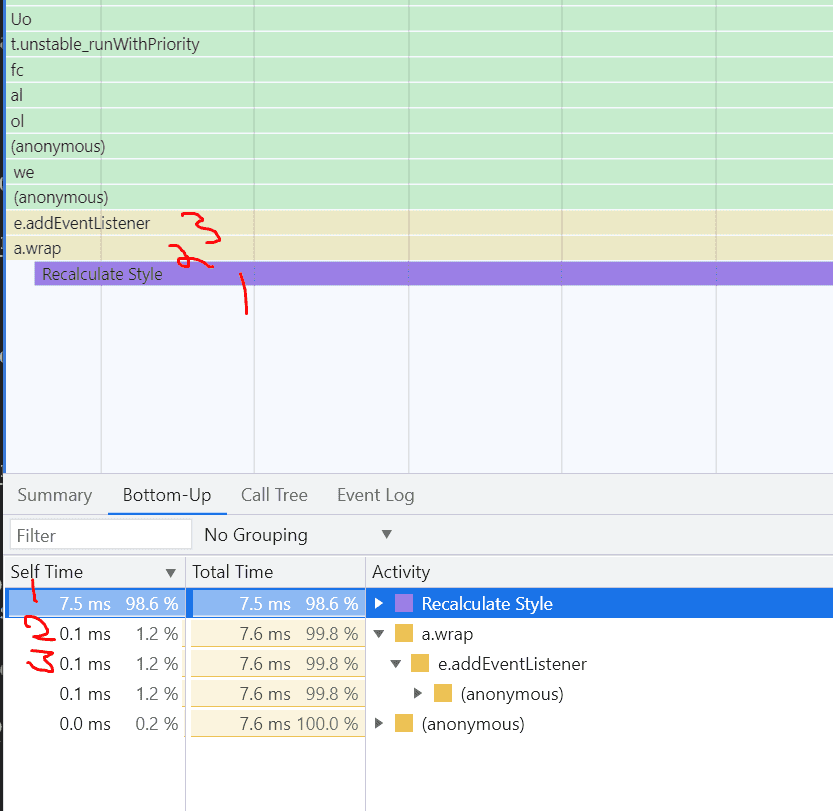
This is covered in my detailed tip on flamegraphs in-depth.
Call Tree Tab
The Call Tree tab provides information on time spent for various CPU / JavaScript activities from a top-down perspective (in order of invocation):
For example, if function a() calls function b(), a's cumulative time to execute is shown on top:
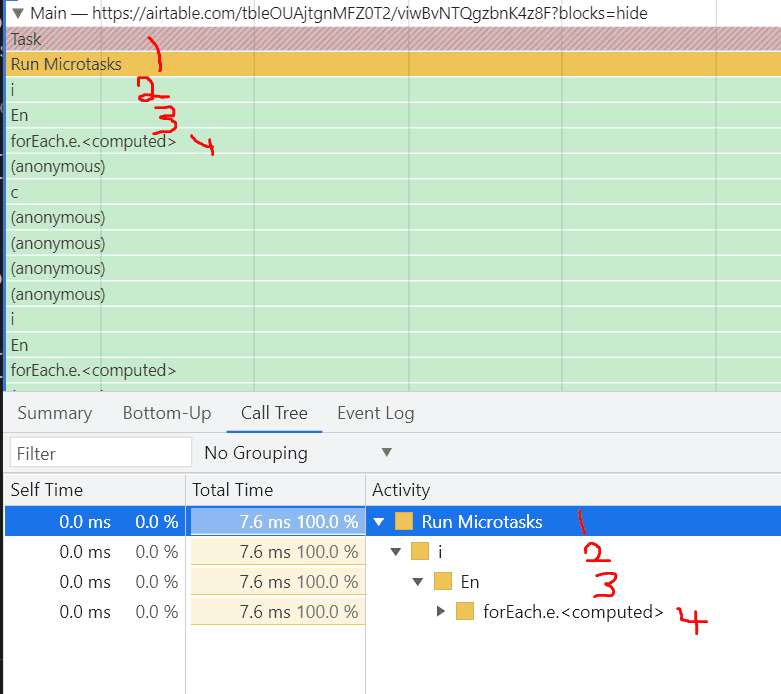
This is also covered in my detailed tip on flamegraphs in-depth.
Event Log Tab
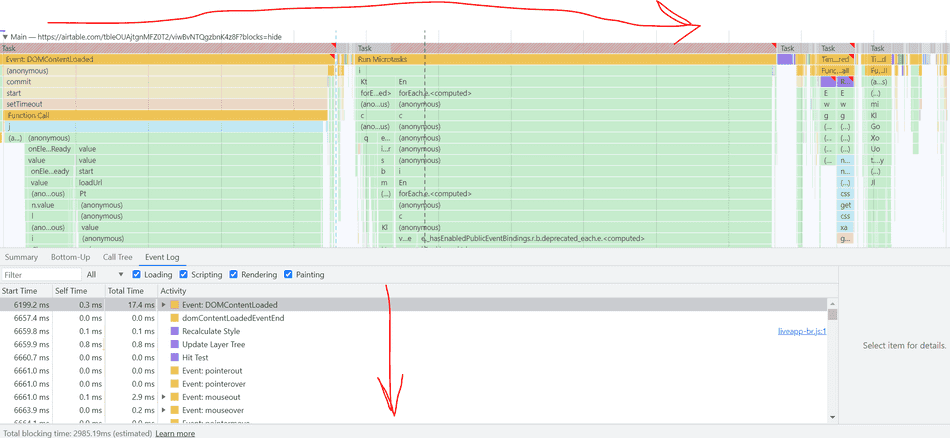
The Event Log tab shows all Events in your selection in order from top to bottom.
It shows the same task information as the Main thread sub-pane from left to right, but ordered in a list view representation:
Conclusion
The UI of the profiler is extremely powerful and it can be confusing to know where to start.
By completing this tip, you can now start to see what your web application is doing as it's running in terms of CPU and Network activity.
I recommend checking out these tips to help you understand the profiler even further:
- How to Read Flamegraphs
- Advanced Profiler UI
- Learn how to use the Profiler Network Pane
- Advanced usage on the Profiler Main Pane
That's all for this tip! Thanks for reading! Discover more similar tips matching Beginner, CPU, and Profiler.

