Measuring with Performance Timing Markers 📏
Measuring allows engineers to identify how their app's time is being spent at runtime.
Setting up proper measurements helps:
- Establish a baseline to compare future optimizations or regressions against
- Distill key user scenarios into reportable metrics for stakeholders
- Quantify how time is spent so you can identify areas of opportunity for improvement
In this tip, we'll discuss the User Timing APIs provided by the browser, and how you can use these to measure the performance of your web app.
Prerequisites
I recommend familiarity with:
- The browser's Event Loop
- The basics of the Chromium F12 Profiler
The performance object
The browser provides a window.performance JavaScript-accessible global object with a variety of performance related helpers.
While there are many interesting properties to explore in this object, we'll only be talking about two in this tip:
performance.mark()- used to mark named timestampsperformance.measure()- used to measure between named timestamps
performance.mark()
performance.mark() allows web developers to define points in time during app execution with high precision timestamps.
It accepts a name parameter, which is used to identify the mark.
Let's look at an example:
function doWork() {
    // Mark the start of Function 1.
    performance.mark('Function1_Start');

    doFunction1();

    // Mark the end of Function 1.
    performance.mark('Function1_End');

    // Mark the start of Function 2.
    performance.mark('Function2_Start');

    doFunction2();

    // Mark the end of Function 2.
    performance.mark('Function2_End');
}
Each invocation of performance.mark() adds a new entry to a browser performance entry buffer. Each entry maintains a timestamp of when mark()
was called.
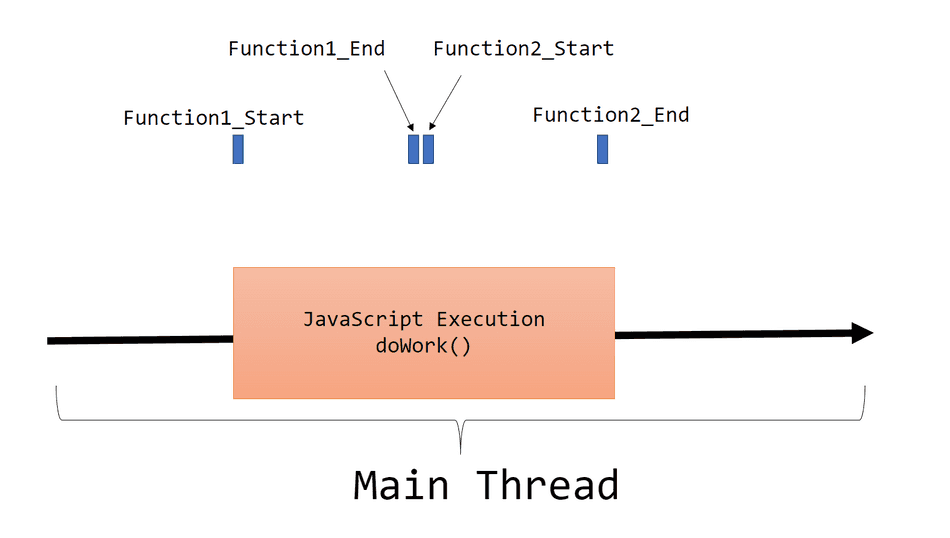
If we visualized this function with its performance marks, it would look like this:

Notably, performance marks do not represent a duration of time, but a point in time.
Note: Don't use
Date.now()(or similarDatemethods) for performance-related timings.Datetimestamps don't have the high-precision characteristics thatperformance.mark()High Resolution Timestamps do.
performance.measure()
The performance.measure() API allows web developers to measure between marks placed by performance.mark().
It accepts a name parameter, used to identify the measure, in addition to the two marks, start and end, that it should measure between.
Let's look at the same example, with newly added performance measures:
function doWork() {
    // Mark the start of Function 1.
    performance.mark('Function1_Start');

    doFunction1();

    // Mark the end of Function 1.
    performance.mark('Function1_End');

    // Mark the start of Function 2.
    performance.mark('Function2_Start');

    doFunction2();

    // Mark the end of Function 2.
    performance.mark('Function2_End');

    // Now that marks are set, we can measure between them!

    // Measure between Function1_Start and Function1_End as a new measure named Measure1
    const measure1 = performance.measure('Measure1', 'Function1_Start', 'Function1_End');

    console.log('Measure1: ' + measure1.duration);

    // Measure between Function2_Start and Function2_End as a new measure named Measure2
    const measure2 = performance.measure('Measure2', 'Function2_Start', 'Function2_End');

    console.log('Measure2: ' + measure2.duration);
}
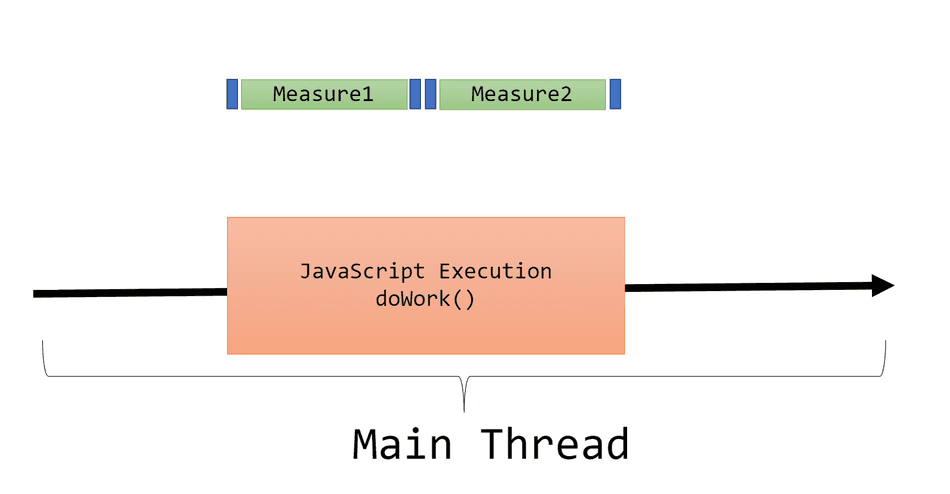
Each invocation of performance.measure() creates a new performance measure, and adds it to the browser's
performance timing buffer. It also returns a PerformanceMeasure object which has a handy duration property,
you can send to your telemetry system.
If we were to visualize this example, this is how it would look:

Asynchronous Tasks
As your application executes operations at runtime, it's likely you'll invoke some asynchronous API, such as requesting network data or responding to an event.
These APIs will queue a task and execute at a later time on the thread.
You can use performance.mark() and performance.measure() to understand how long it takes to complete
these scenarios across asynchronous operations!
Let's consider this example:
button.addEventListener('click', () => {
    performance.mark('ButtonClicked');

    fetch('data.json').then(res => res.json()).then(data => {
        performance.mark('DataRetrieved');

        renderDialog(data);

        performance.mark('DialogRendered');

        // Measure time waiting for data to arrive on the thread.
        performance.measure('WaitingForData', 'ButtonClicked', 'DataRetrieved');

        // Measure time required to render the modal once data arrived.
        performance.measure('RenderTime', 'DataRetrieved', 'DialogRendered');
    });
});
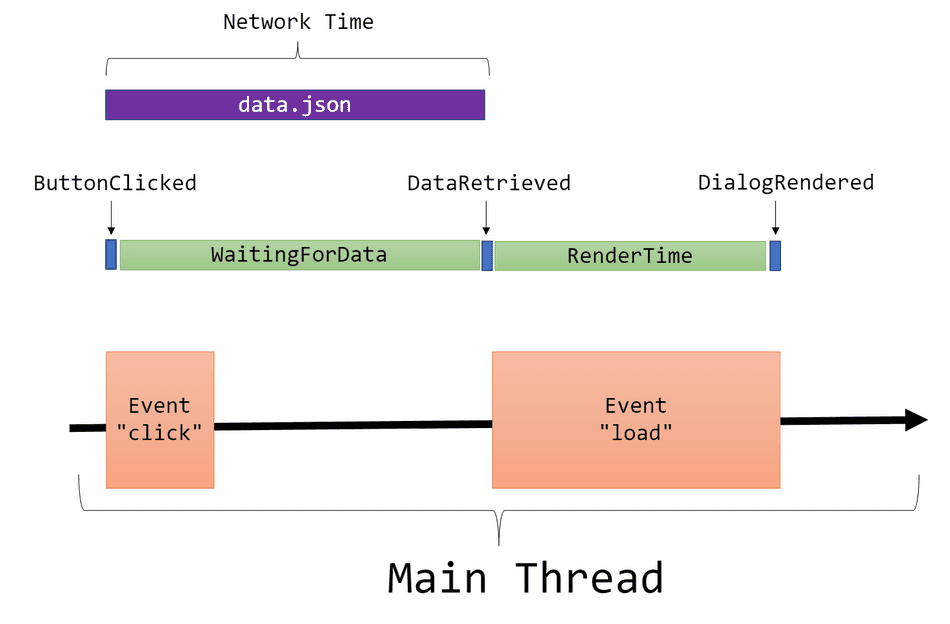
In this example, we measure two periods of time,
WaitingForData- The time between a user clicking a button and data arriving on the threadRenderTime- The time between data arriving and the DOM updates being completed.
If we were to visualize this example, it would look like this:

Note: Measuring network dependency (
data.jsonin this example) time in this way doesn't just measure network time -- it measures time for a network resource to be available on the main thread.Learn more about the differences in this advanced tip about loading network resources
Note 2: While we are measuring the time to create the DOM here, we are not including the time for the pixels to appear on the screen. Learn more in my tip on measuring frame paint time.
Profiler Visualization
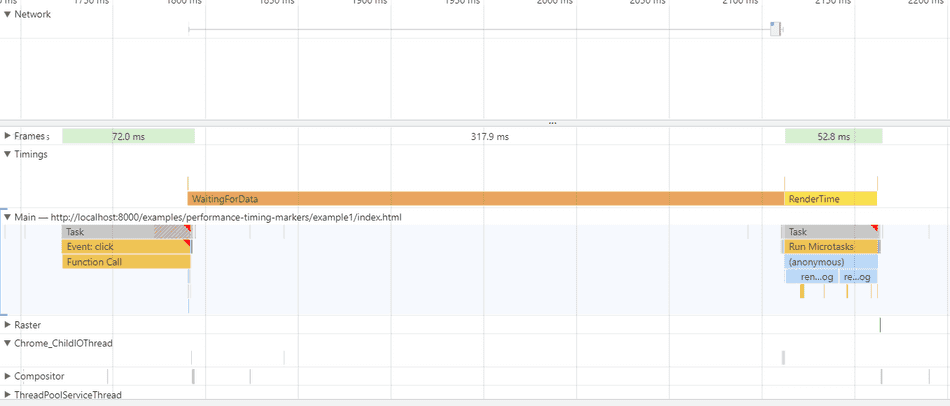
Performance marks and measures are extremely handy when profiling your user scenarios. The Chromium Profiler will actually visualize these in the Analysis Pane.
I've put together the above example in this demo page so we can profile it.
If you click the button in the example while collecting a profile, you will see the performance marks and measures in the Timings pane in the Profiler's selection analysis pane:

In this example, you can see the measures labeled, and the marks are there, too, albeit small and require hovering to identify:

A note on Firefox
Firefox does support performance.mark(...) and performance.measure(...), but has one key implementation deviation: performance.measure(...)
does return return a PerformanceMeasure object, and always returns undefined!
So for Firefox compatibility, I recommend the following code:
performance.mark('Function1_Start');

doFunction1();

// Mark the end of Function 2.
performance.mark('Function1_End');

// Now that marks are set, we can measure between them!

// Measure between Function1_Start and Function1_End as a new measure named Measure1
let measure1 = performance.measure('Measure1', 'Function1_Start', 'Function1_End');

if (!measure1) {
    // Firefox case. We explicitly need to get it from the performance buffer
    measure1 = performance.getEntriesByName('Measure1', 'measure')[0];
}

console.log('Measure1: ' + measure1.duration);
Conclusion
With performance marks and measures in place, you can now start quantifying how fast your app's scenarios are at runtime.
You can connect the duration properties of your measures to your telemetry system to build an understanding for how fast scenarios
are for real users.
I recommend checking out these tips next:
That's all for this tip! Thanks for reading! Discover more similar tips matching Beginner and Measuring.

