Chromium F12 Profiler: The Main Thread Pane
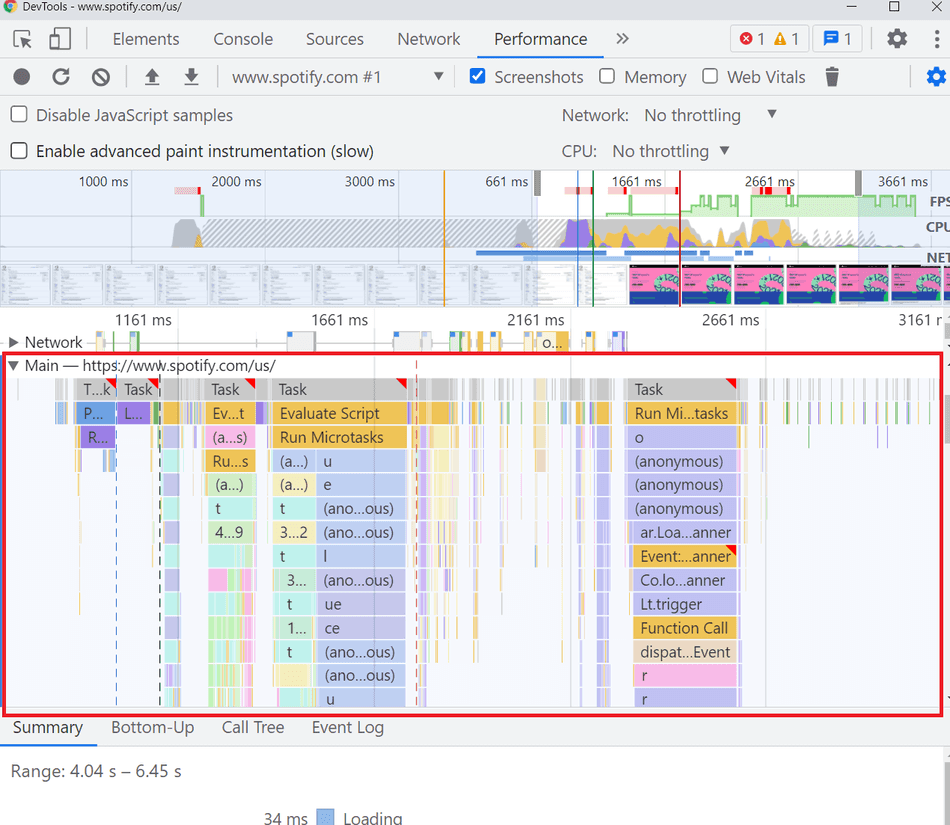
The majority of my time spent analyzing the CPU component of a web application's performance trace is within the Chromium F12 Profiler's Main Pane.
This pane visualizes all CPU activity taking place on the Main Thread, including Tasks and Rendering Frames.
In this tip, we'll discuss this Main Pane in detail, and how to read it effectively.
Prerequisites
You should collect a trace and familiarize yourself with the basic of the Chromium F12 Profiler.
Representing Time
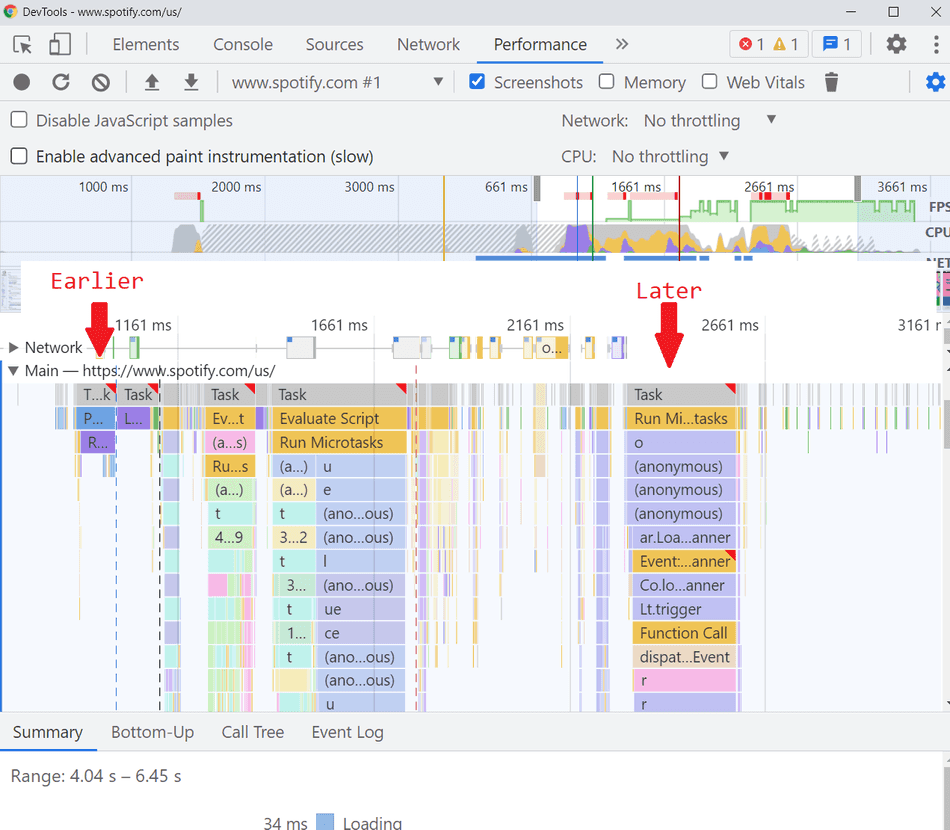
Like all Panes in the Chromium F12 Performance Profiler, time is represented from left to right. This means the earlier events collected during the Trace are represented on the left, with later events filling in from left to right:
Tasks
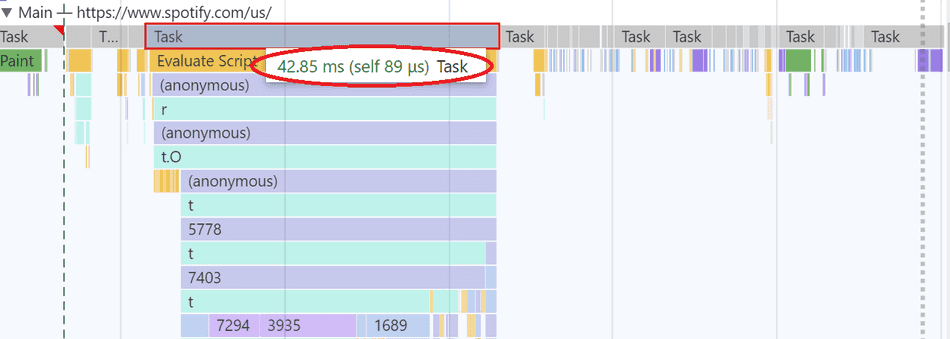
Each unit of execution that takes place on the Main Thread is called a Task.
Tasks are visualized as grey blocks (representing their time to execute). JavaScript Tasks also will have detailed callstack information visualized as a flamegraph.

Not all Tasks that take place on the Main Thread will be JavaScript Tasks, and, as a result, not all Tasks will have a detailed flamegraph in the F12 Profiler.
You can see the time it takes to execute a Task by hovering over the root Task band:
Thread Inactivity
If there is no Task taking place on the Main Thread, the Profiler UI will leave that section of time as empty:
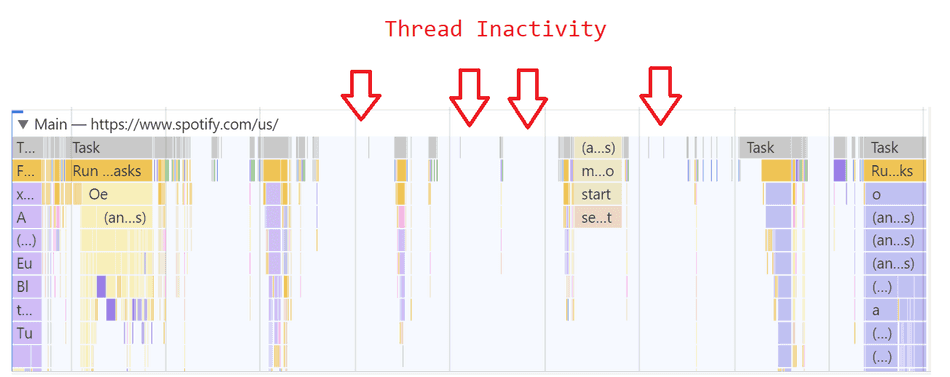
The design of the browser event loop is intentionally non-blocking. If there is sizeable gaps representing Main Thread inactivity, that could indicate you are not giving the browser any work to do.
Note: Depending on your scenario, you may or may not want the Main Thread to have period of inactivity. Learn about this more at my detailed tip on Main Thread inactivity.
Task Colorization
In the Tasks presented in the Chromium F12 Main Thread pane, the Profiler will colorize certain activities consistently to make it easy to visually spot bottlenecks or inefficiencies.
Parsing
HTML and CSS parsing get colorized as a Blue color:

JavaScript Tasks
JavaScript engine related Tasks are usually colorized as an Orange color at the base:
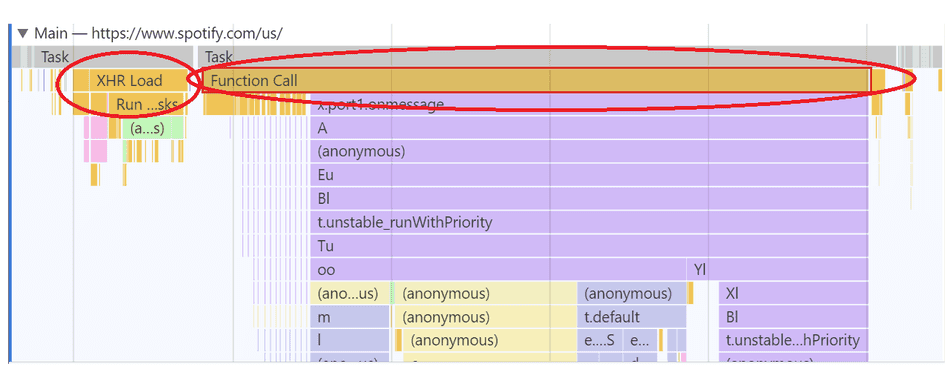
JavaScript engine related Tasks include script compilation, executing event listeners, firing timers, garbage collection, and any other JavaScript-related work.
Below the engine-related bands, JavaScript callstacks are colorized consistently based on what script is executing the captured stack frame in the flamegraph:
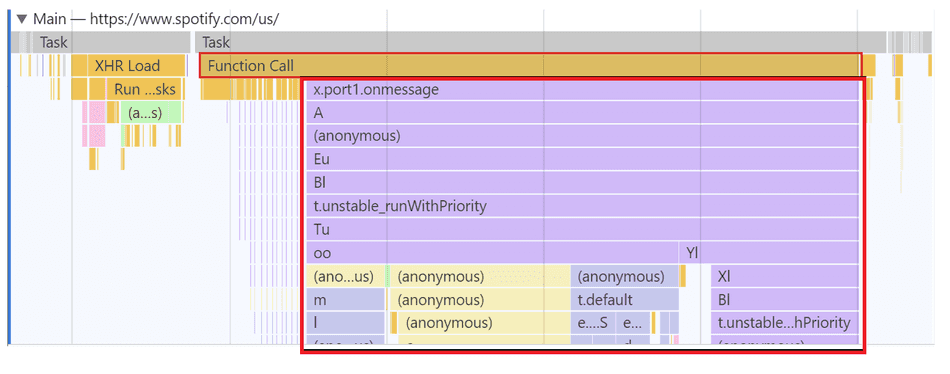
In this example, several scripts are included in the callstack. In the Profiler, each script gets assigned a consistent color across the trace for each stack frame originating from it.
Browser APIs
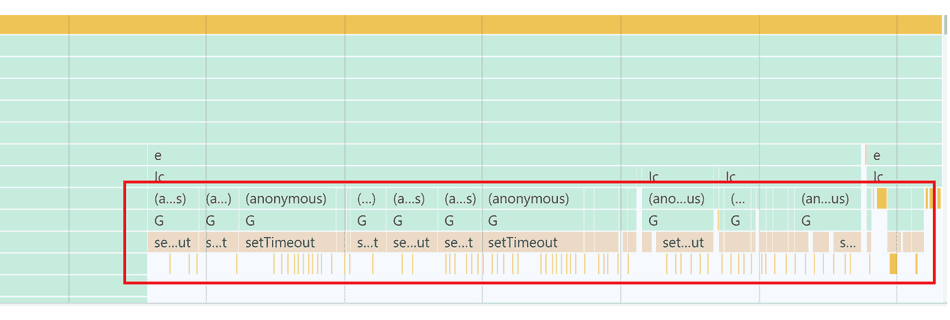
In a JavaScript callstack, occasionally, you will see a Brown color. This
indicates that the work taking place is a browser API, like setTimeout or createElement:
Style and Layout
As part of the browser's Rendering Pipeline Recalculate Style and Layout will run intermittently. These will be colorized as a Purple:

The purple colorization is usually related to any work that updates or interacts with the data structures that back the visual elements on the page.
Paint and Compositing
Shortly after Recalculate Style and Layout run, the browser will typically run a Paint event, and sometimes some additional Composite Layers work. These will be colorized as Green:

Work colorized as Green typically indicates the browser is preparing to generate pixels to the UI, and is doing (or preparing to do) some sort of graphics related work to display a Frame.
Tying Back to the Trace Overview
At the top of the Profiler, there's the Trace Overview section:
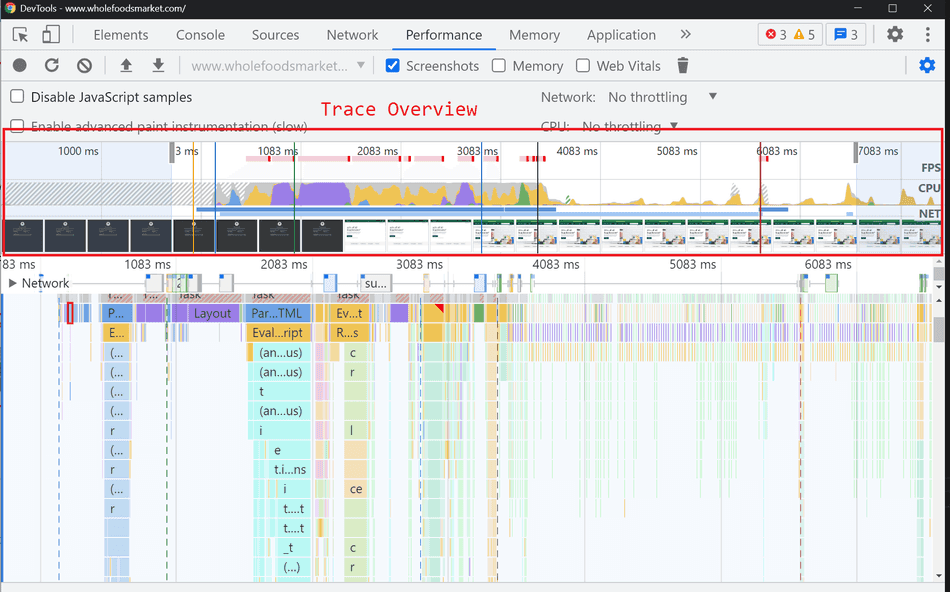
We can use our expanded knowledge of Profiler colors to quickly spot regions of activity or inactivity, and guess as to what kind of activity is taking place.
For example, in my trace, I can quickly see in the Trace Overview section what type of work is taking place primarily:
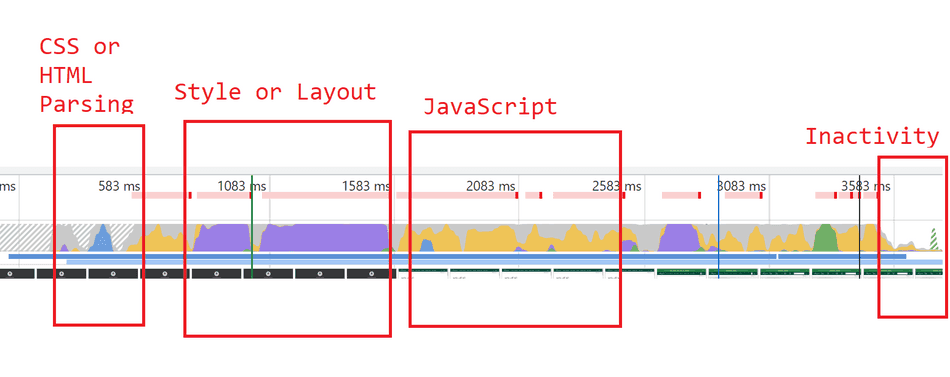
Furthermore, I can use the Selection capabilities of the Profiler to drill into the region of interest. For example, if I wanted to look at what was taking place in the CSS or HTML Parsing block I called out above, I can scope the selection to it:
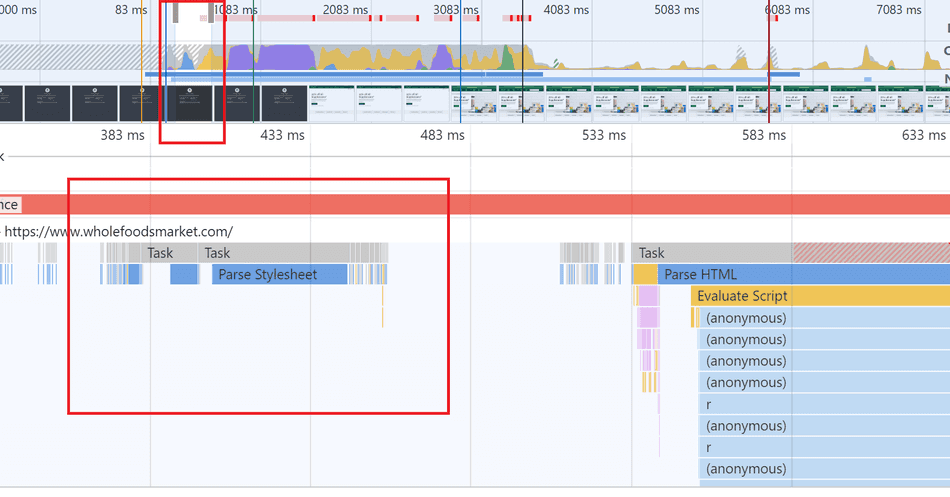
Here I can see the majority of this time is going to parsing a Stylesheet.
Conclusion
With this knowledge, you can more easily find and understand how the browser is executing your web application, so you can quickly spot inefficient regions of interest.
That's all for this tip! Thanks for reading! Discover more similar tips matching CPU and Profiler.

