How to Read Flamegraphs 🔥
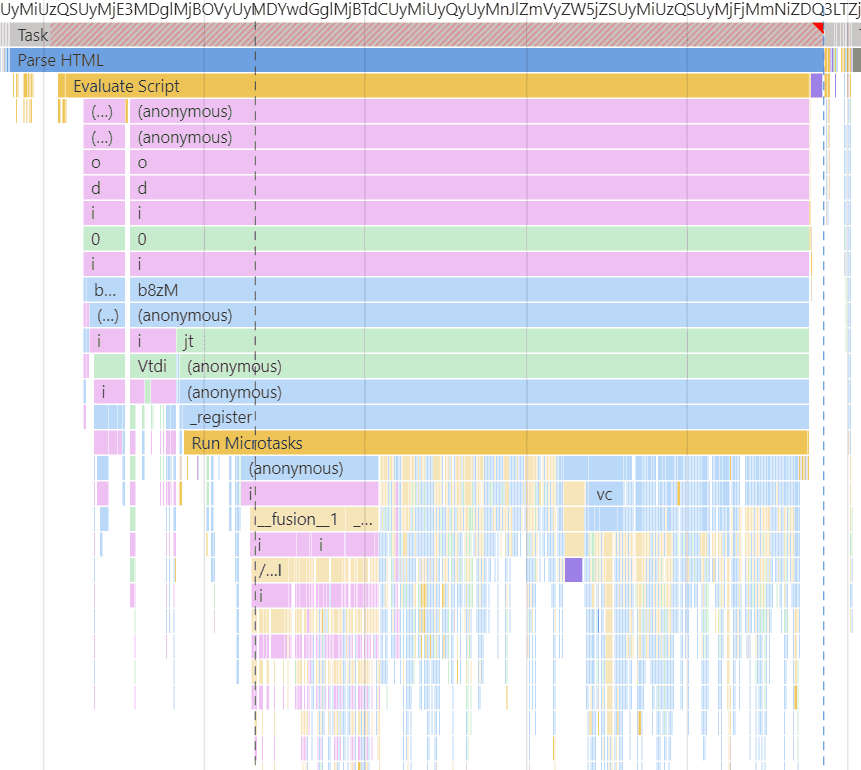
Flamegraphs are the industry-standard way to visually represent runtime code stack traces and their respective time to execute as a hierarchy.
These graphs are designed to help engineers quickly identify bottlenecks and frequently run codepaths.
Below is an example Flamegraph produced by the Chromium Profiler:
A Simple Example
Consider the following functions:
function c() {
    // Do something for 50ms
    const start = Date.now();
    while (Date.now() - start < 50) {
        /* block the thread */
    }
}

function b() {
    c();
}

function a() {
    b();
}

a();
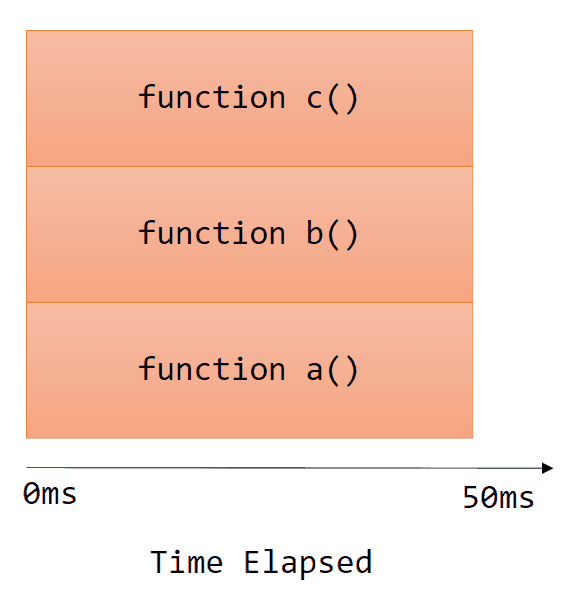
In this example, function a() calls function b(), and function b() calls function c().
Notably, function c() takes 50ms to complete.
To represent this call stack as a flamegraph, we would do the following:
More complex examples
Let's adjust function b() to invoke function c() 3 times, instead of just once.
function b() {
    c();
    c();
    c();
}
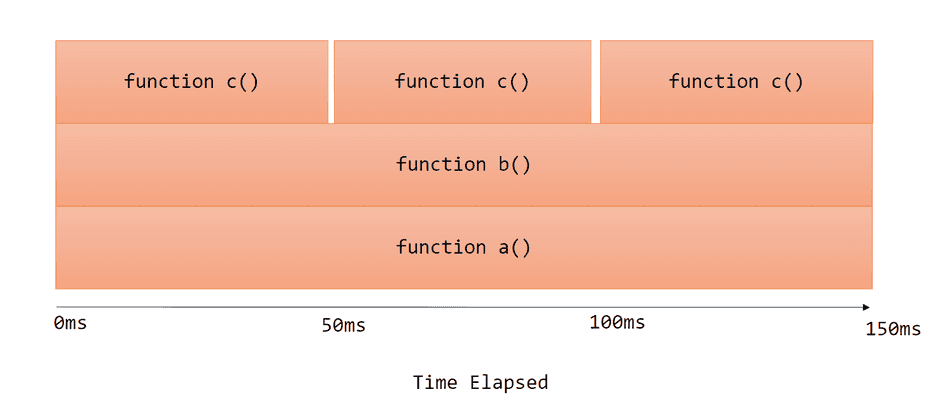
This will initiate 3 calls to function c(), each taking 50ms.
The produced flamegraph will look like this:
Notice the following:
function c()is represented in 3 separate 50ms blocks, each block has a 50ms cumulative time.function b()is represented as 1 150ms block, so its cumulative time is 150ms.function a()is represented as 1 150ms block, so its cumulative time is 150ms.
Let's apply one more adjustment and produce another flamegraph, this time to function a().
function a() {
    b();
    b();
}
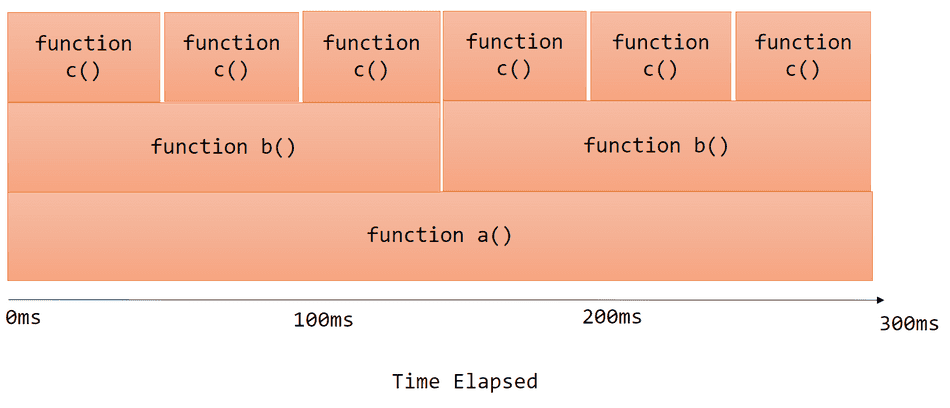
Now, function a() invokes function b() twice.
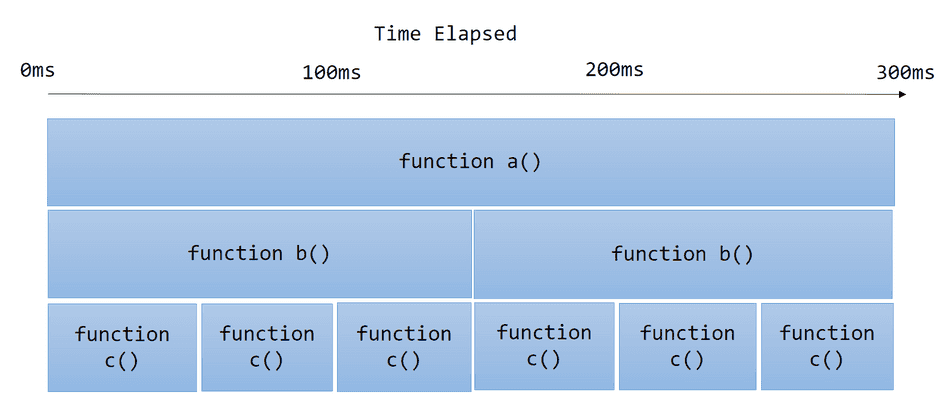
The produced flamegraph will look like this:
Notice the following:
function c()is represented in 6 separate 50ms blocks, each block has a 50ms cumulative time.function b()is represented as 2 150ms block, each block's cumulative time is 150ms.function a()is represented as 1 300ms block, so its cumulative time is 300ms.
Traditional Flamegraphs vs. Chromium Profiler Icicle Graphs
The flamegraphs I've shown in the examples so far are traditional flamegraphs. Many performance profilers will produce graphs that look exactly like what I've shown.
However, the Chromium F12 Performance Profiler produces a variant of the traditional flamegraph, known as an icicle graph.
Icicle graphs visualize the exact same data as flamegraphs, except flip the y-axis direction.
For example, in that last example, the Chromium F12 Performance Profiler icicle graph would look like this:
Looking at a real graph
I captured a Chromium Performance Profile of our example code we've been referencing, and this is what icicle graph was produced!
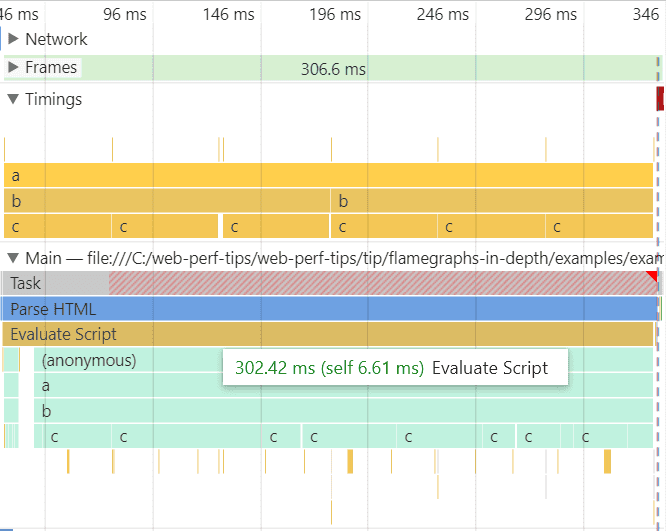
You can collect a profile of this scenario and inspect yourself by collecting a Page Load trace of this example page.
Note here that due to the way the profiler collects data while tracing the browser at runtime, you don't see nice even 50ms blocks for function c()
and function b() calls in the Main pane. I've added custom performance timing markers so we can compare what the profiler
collected with more precise custom markers captured in the Timings pane.
What's really important here is that you can inspect the cumulative times of each function in the callstack, and see which function calls are adding up to the 302.42ms cumulative time.
What's clear from the captured graph in the Main pane:
- There's a single JavaScript execution Task that has a cumulative time of 302.42ms
- This Task has a fairly short call stack (4 stack frames):
(anonymous),a,b, andc - The stack frame for
cis invoked in high frequency and is the sole contributor to the 302.42ms cumulative time of the JavaScript task.
Conclusion
You now understand and can read basic flamegraphs!
Consider checking out my tip on flamegraphs in-depth to read more advanced flamegraphs!
That's all for this tip! Thanks for reading! Discover more similar tips matching Beginner, CPU, and Flamegraphs.

