Flamegraphs In Depth 🔥🔥
Performance profiles of modern web applications usually produce flamegraphs of significant complexity.
In this tip, we'll look at more complex flamegraphs produced by the Chromium F12 Profiler and learn helpful techniques for reading them.
Note, although the Chromium Profiler technically produces icicle graphs, I will just refer to them as flamegraphs.
Prerequisites
- You should have a trace collected of your web application.
- You should know the fundamentals of basic flamegraphs.
Tasks
In the Chromium F12 profiler, a flamegraph is usually produced for each JavaScript Task that takes place on the Main UI thread.
Tasks that are long and inefficient can degrade user experience by delaying the browser's ability to generate frames.
Shape
The shape of a flamegraph (or a subsection of a flamegraph) can provide great clues into CPU bottlenecks on your thread.
The first function on the callstack is represented as the base of the flamegraph, and the last functions on the callstack are represented at the tips.
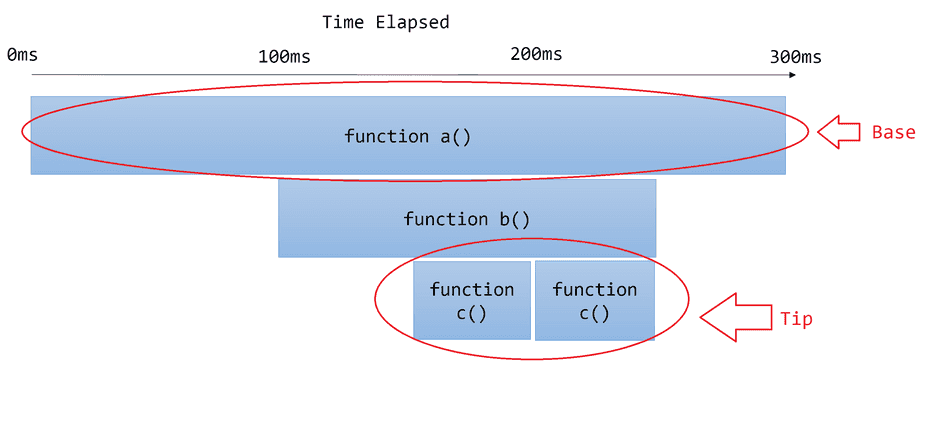
Wide Shape
If a flamegraph is wide from the base or other sub-sections, this indicates synchronous, slow, or heavy work taking place on the thread.
Here's an example of a wide flamegraph with a wide base and a wide subsection near the tip:
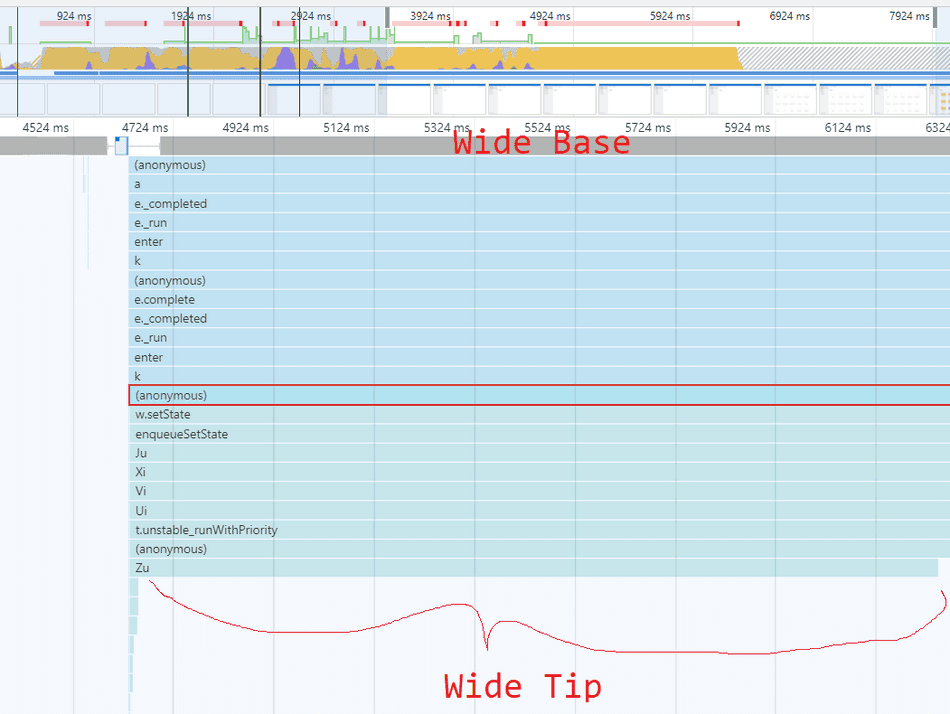
In general, I recommend starting from the base of wide flamegraph sections, and trace the graph towards the tips (working from top to bottom in the Chromium F12 profiler), following the widest bands as you go. This will help you find the largest areas of opportunity within that inefficient section.
Consider this example flamegraph:
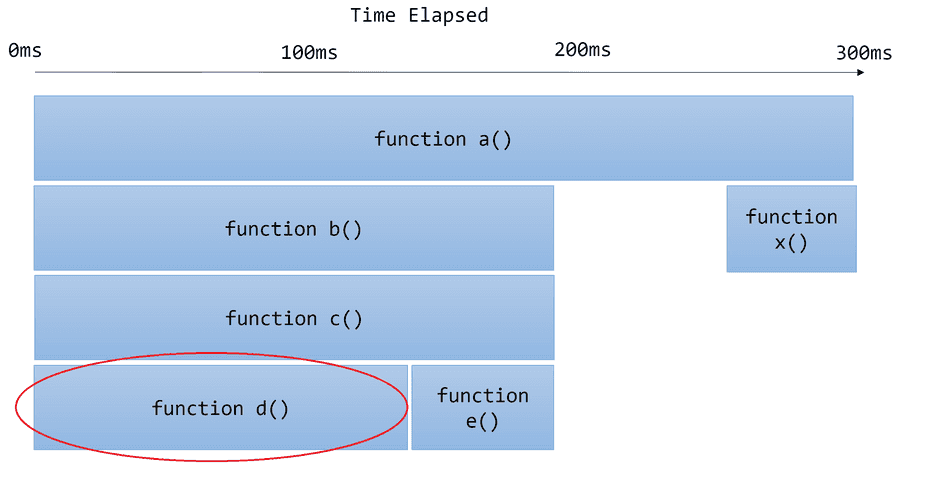
If I was going to try and optimize this call stack, I would:
- Start looking at
function a()at the base - Notice it calls
function b()andfunction x().b()looks wider, so I'd investigate that next. - Notice
function b()callsfunction c() - Notice
function c()callsfunction d()andfunction e() - Investigate what
d()is doing, becaused()is wider.
In my experience, usual culprits of wide bands are:
whileorforLoops with a high iteration count- Highly computational work
Narrow Shape
A flamegraph that resembles a narrow spike indicates that the time to execute is short, but the callstack is deep.
Here are some example narrow-shaped flamegraphs:
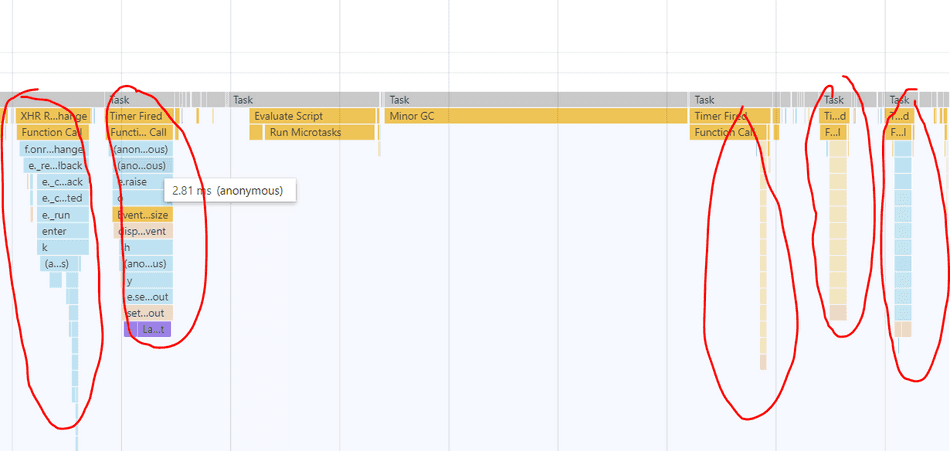
A narrow spike doesn't necessarily indicate a CPU bottleneck in isolation, but sometimes, narrow spikes in high frequency can produce bottlenecks. This usually manifests as a wide band in the profiler, topped with many narrow spikes.
Here's an example of many narrow spikes aggregating into a wide band, indicating a bottleneck:
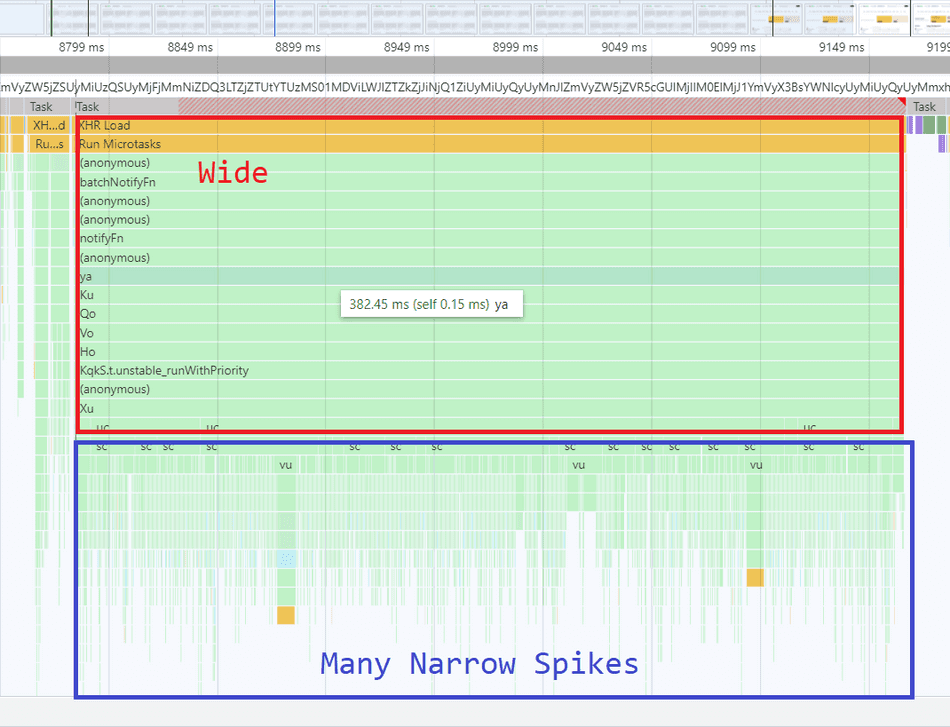
The inefficient / interesting parts of a narrow spike are often near the tip of the spike:
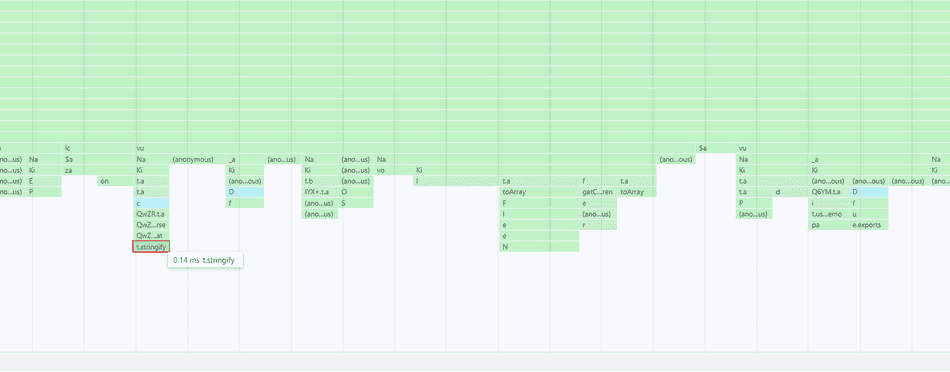
In this example, each spike is executing some micro-operations of about 0.14ms each, like toArray() and stringify, etc., and we
can find this info at the tip of each spike.
What we are looking at is essentially the below example:
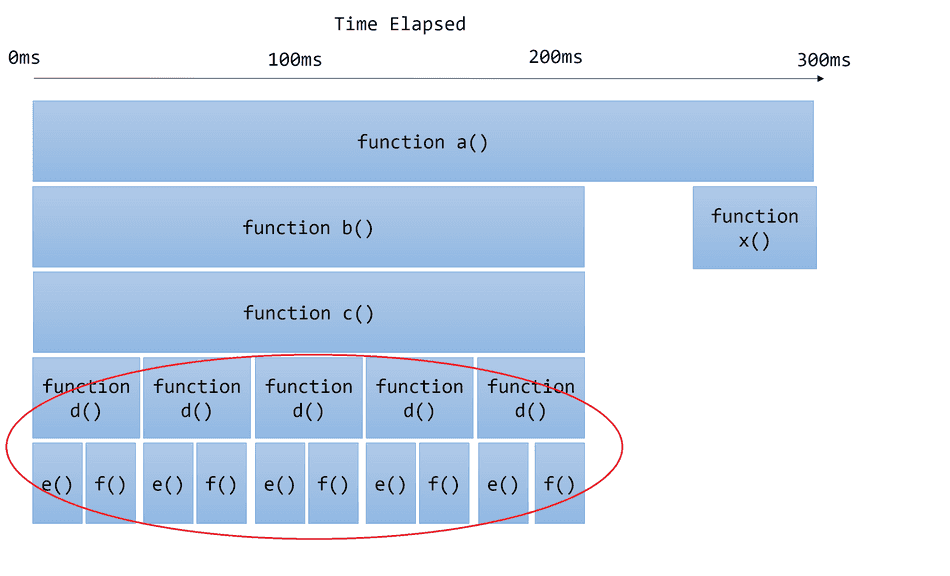
Notice in this example, d() is invoked in high frequency, which invokes e() and f() in high frequency, creating a bottleneck in c().
Usual suspects I find at the tips of narrow spikes often include:
- Browser APIs like
createElement,setTimeout, etc. RegExptesting- String operations (like URL parsing,
JSON.stringify) fororwhileloops with a low iteration count
Colors
The Chromium Profiler will colorize JavaScript stack traces based on which script is executing.
It's common for modern web applications to code split their JavaScript payloads, and as a result, there will be multiple scripts executing functions within the same call stack.
Consider this example below:
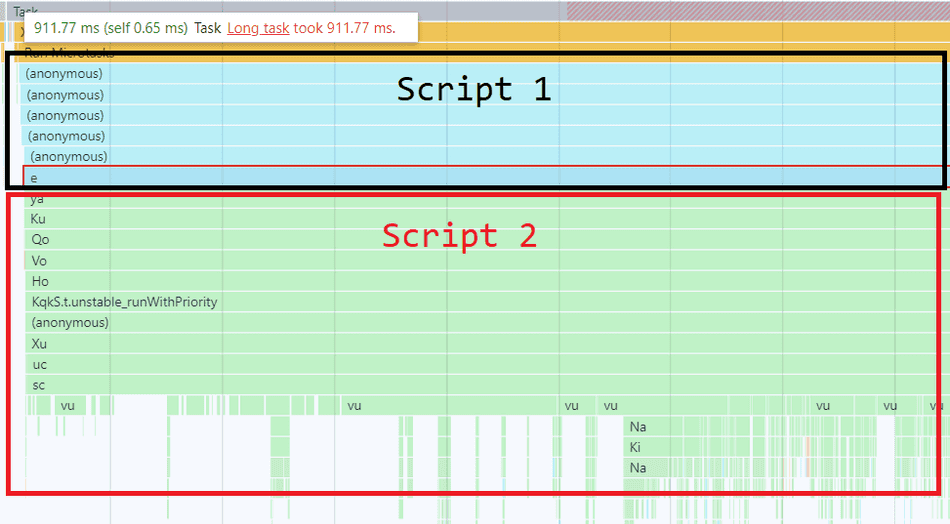
Script 1 gets colorized as Blue, and is at the base of the flamegraph. Script 2 is colorized as Green and is the callee of Script 1, lower in the flamegraph and at the tips.
At first glance, one might attribute this Task's CPU time to Script 1, because it's at the base of the flamegraph. However, because Script 2 clearly contributes to the bulk of the work (most of the flamegraph is Green, especially at the tips) we can infer that codepaths in Script 2 are the likely inefficient culprits in this Task.
If you see patterns or shapes that appear to be resulting from a particular color in high frequency, that can help you quickly identify which script or part of your application is contributing to the bottleneck.
In this example below, there's a clear pattern of a Green script invoking a call stack colorized as Brown that appears slow and run in high frequency.
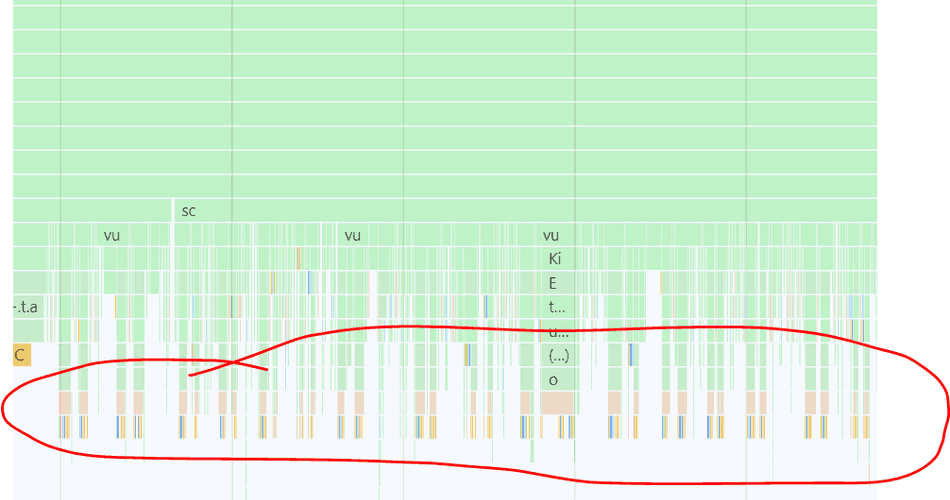
There are also a set of reserved colors, attributed to certain browser tasks that can help you spot inefficient invocations of browser APIs, such as Layout or
setTimeout.
Script and Function Name
Selecting a call stack frame will show which script is executing in the Summary pane:
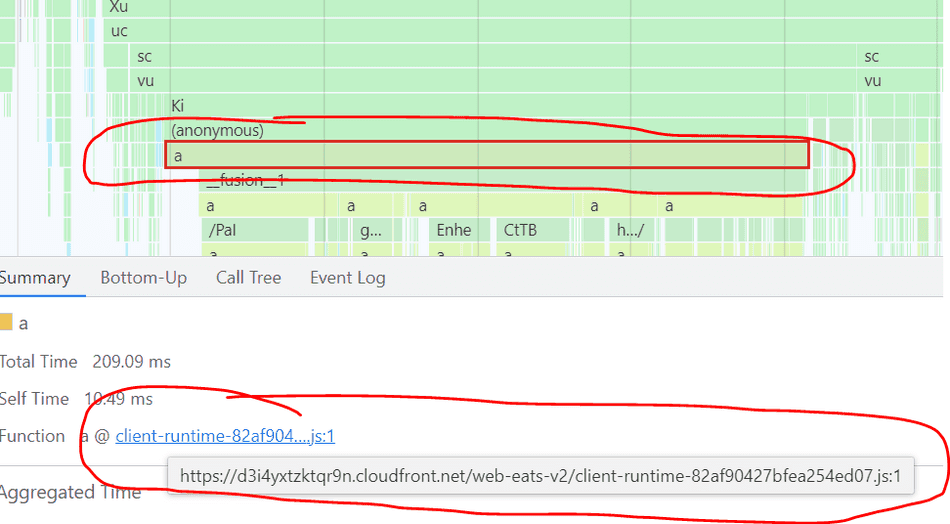
The Chromium Profiler will map each stack frame in a flamegraph to the name of the executing function:
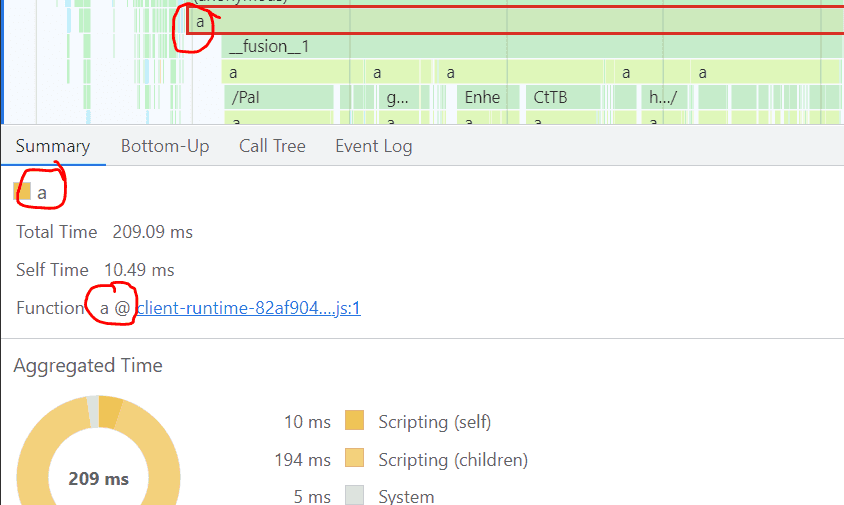
In this example above, a is the name of the function, and it's found within client-runtime... script.
Production web applications apply minification, so the names are often short and non-descriptive.
Follow this tip on scoping to codepaths in the profiler for details on how to scope to a particular codepath of interest in your flamegraph.
Conclusion
We have walked through some common real-world flamegraph patterns and shapes.
We've also looked at how the Chromium Profiler aids our analysis by colorizing and labeling call stacks.
You should see similar flamegraphs in your web application traces and can now understand what's going on in those complex flamegraphs.
Consider these tips next!
- The Chromium Main Profiler Pane explained
- Scoping to codepaths in the profiler
- The Browser Event Loop
- Code Splitting
- Minification
That's all for this tip! Thanks for reading! Discover more similar tips matching CPU and Flamegraphs.

