Using the Chromium Network Tab for Performance Insights
The Chromium Network tab has many capabilities, ranging from payload previews, request blocking and replaying, traffic filtering, and much more!
I like to think of the Chromium Network Tab as a browser-integrated Fiddler.
While I mostly do my network performance analysis in the Chromium Profiler Network Pane, I do use a few features of the Chromium Network Tab from time to time in performance analysis.
Opening the Network Tab
On your web app, open the Chromium Developer tools via F12 or Right-click, Inspect Element, and select the Network tab:
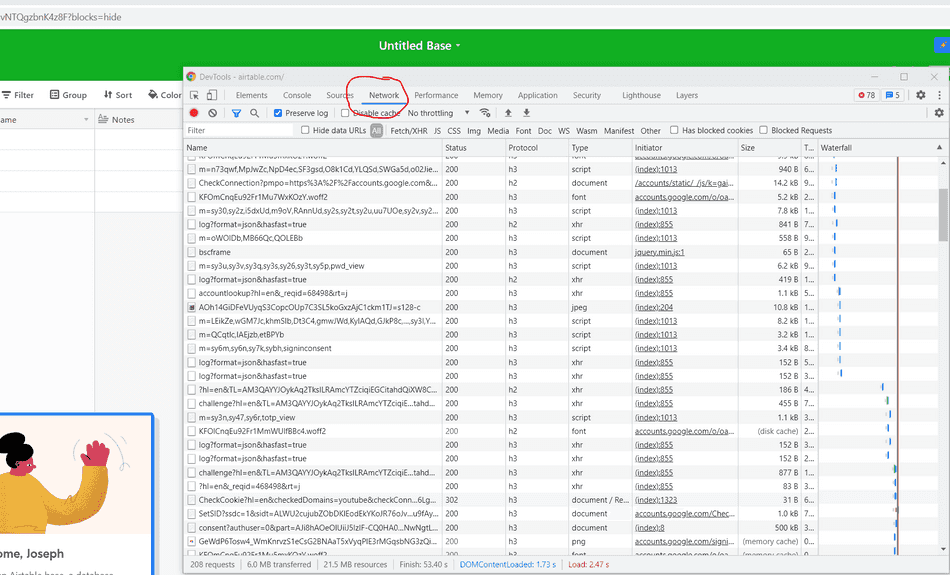
In this UI, you will see each of your app's network requests as entries in a table.
Size Metadata
Resource size directly impacts page performance, in both time to transfer, and time to parse or decode. Therefore, I often inspect the Size column of this table:
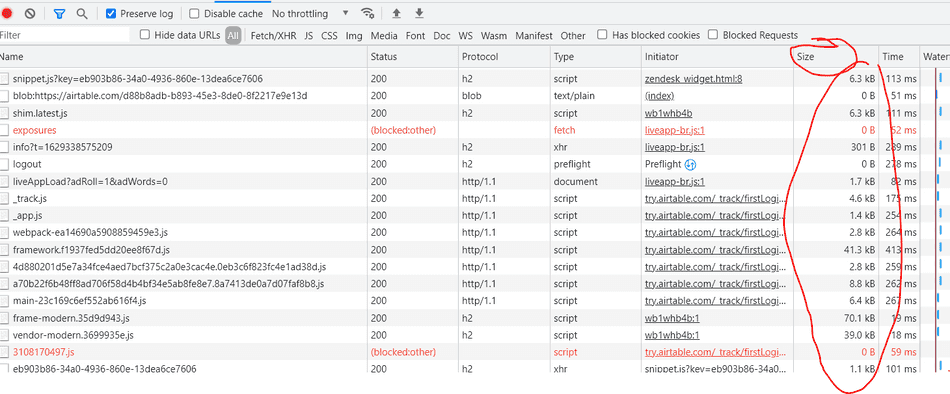
The size that's displayed in the column is the Transfer Size, or, Number of Compressed Bytes sent over the network.
Most production web applications (should!) compress resources before serving them to their users. Common compression algorithms include gzip and brotli.
Hovering over the Size table cell will reveal the actual Resource Size (decompressed size):

Cache
If a resource is loaded from Disk Cache, Service Worker Cache, or other browser caches, the table cell will denote that instead of providing the Transfer Size (because there were no bytes transferred over the network).
To see the Resource Size for a file loaded from cache, hover over the same table cell:

Time and Waterfall
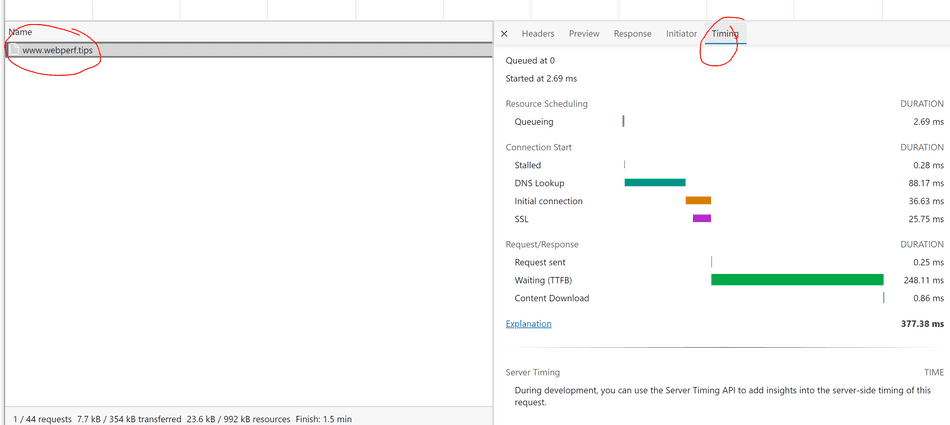
In the Time column, the Network tab notes how long a network request took from the initial request to being fully downloaded.
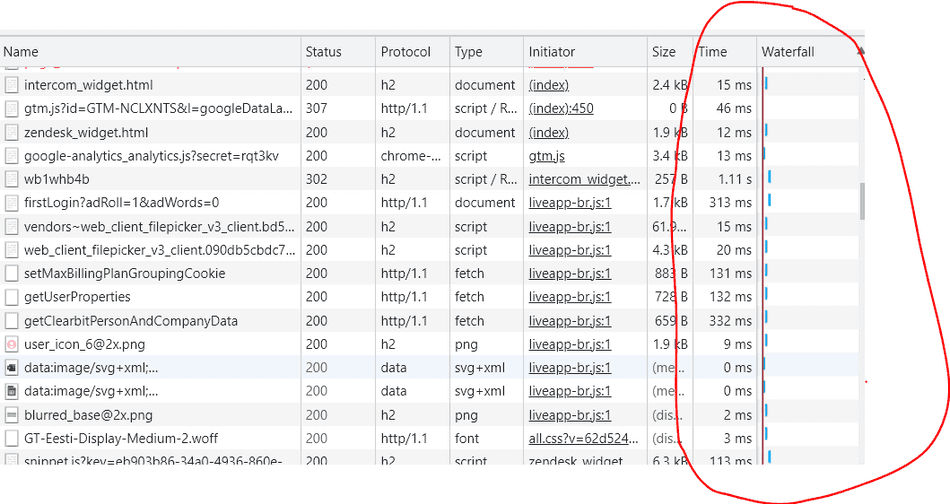
Hovering over a Waterfall column cell provide insight into how that time was spent.
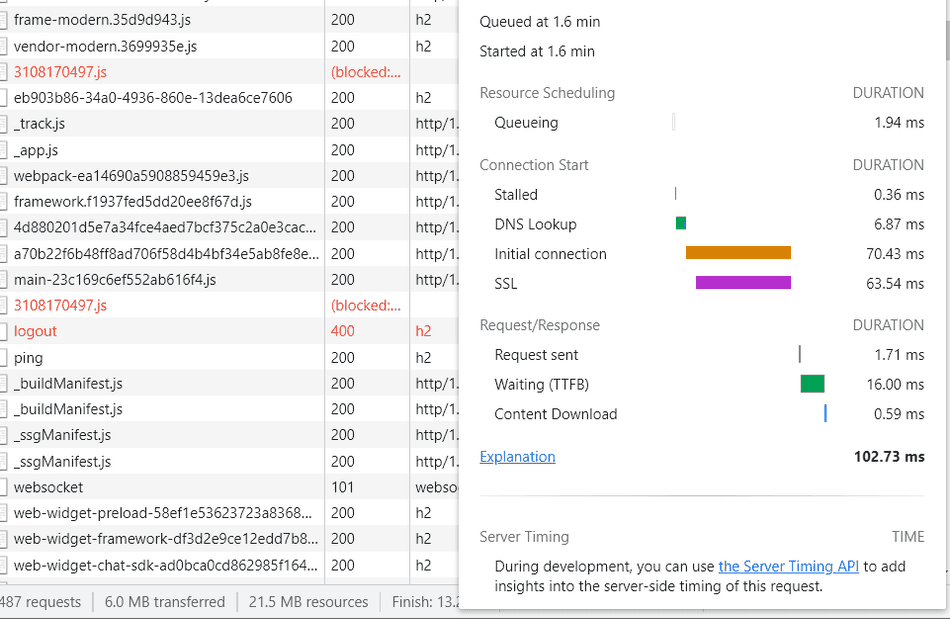
You can alternatively get to the request waterfall by clicking the request, and selecting the Timing Tab.
Protocol
If this one isn't displayed by default, right-click on the table-headers, and select Protocol:
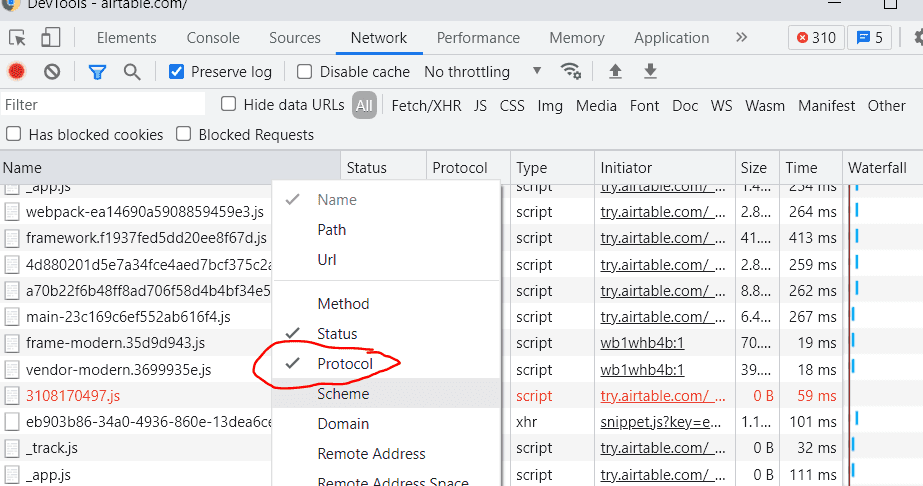
In general, critical resources should be using HTTP/2.0 to maximize parallel connections and minimize queueing time.
HTTP/2.0 connections are displayed as h2.
Note: As of writing this, HTTP/3.0 is not at mainstream adoption, but it further improves on HTTP/2.0 in terms often reducing connection establishment time while maintaining multiplexing.
Disable Cache
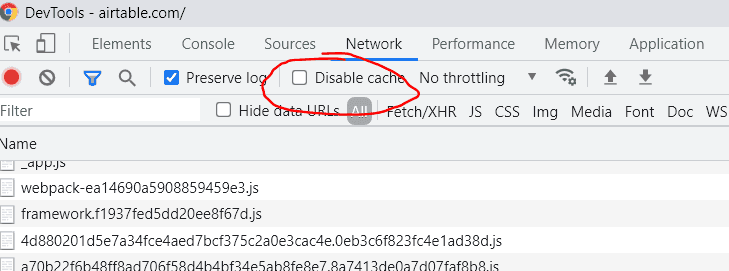
The browser caches network resources to minimize network dependency for repeat visits. However, if you want to simulate a user visiting your page without browser caches populated (for example, a first visit scenario), then you can check the Disable Cache option:
Throttling
Many times our development machines are connected to fast networks, so network performance issues don't manifest as we profile our web apps.
You can use the Throttling dropdown to simulate a slower connection:
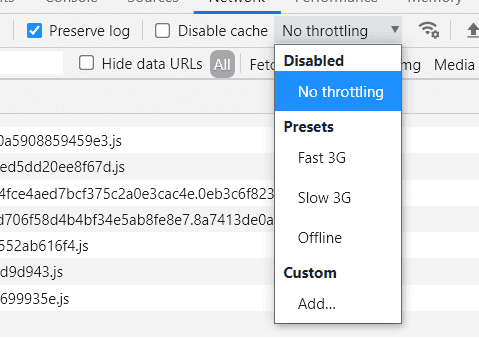
Combine this option with Disable Cache to really highlight your app's network dependency and bottlenecks.
HAR Import and Export
Unlike the performance profiler, the Network Tab imports and exports captured sessions
as HTTP Archive Files, or .har files.
Export
If you want to share some findings in the Network tab with your team, you can export your entire logs session via the Export HAR option:

Import
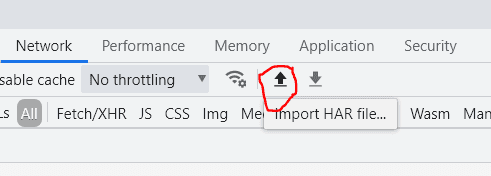
You can also import .har files via the Import HAR button:
Conclusion
While there are many powerful features of the Chromium F12 Network Tab, these cover the ones I use for performance analysis of the network.
Consider reading up on the difference between Transfer Size and Resource Size next!
That's all for this tip! Thanks for reading! Discover more similar tips matching Beginner and Network.

