Eliminating Choppy Scrolling in OneDrive Web with a One-Line Change
I use Office 365 for my personal productivity tool of choice and often use the OneDrive web UX to manage my personal files and photos.
Recently, I was re-organizing the files in my personal OneDrive and observed a frustrating choppiness while scrolling through my OneDrive files grid:
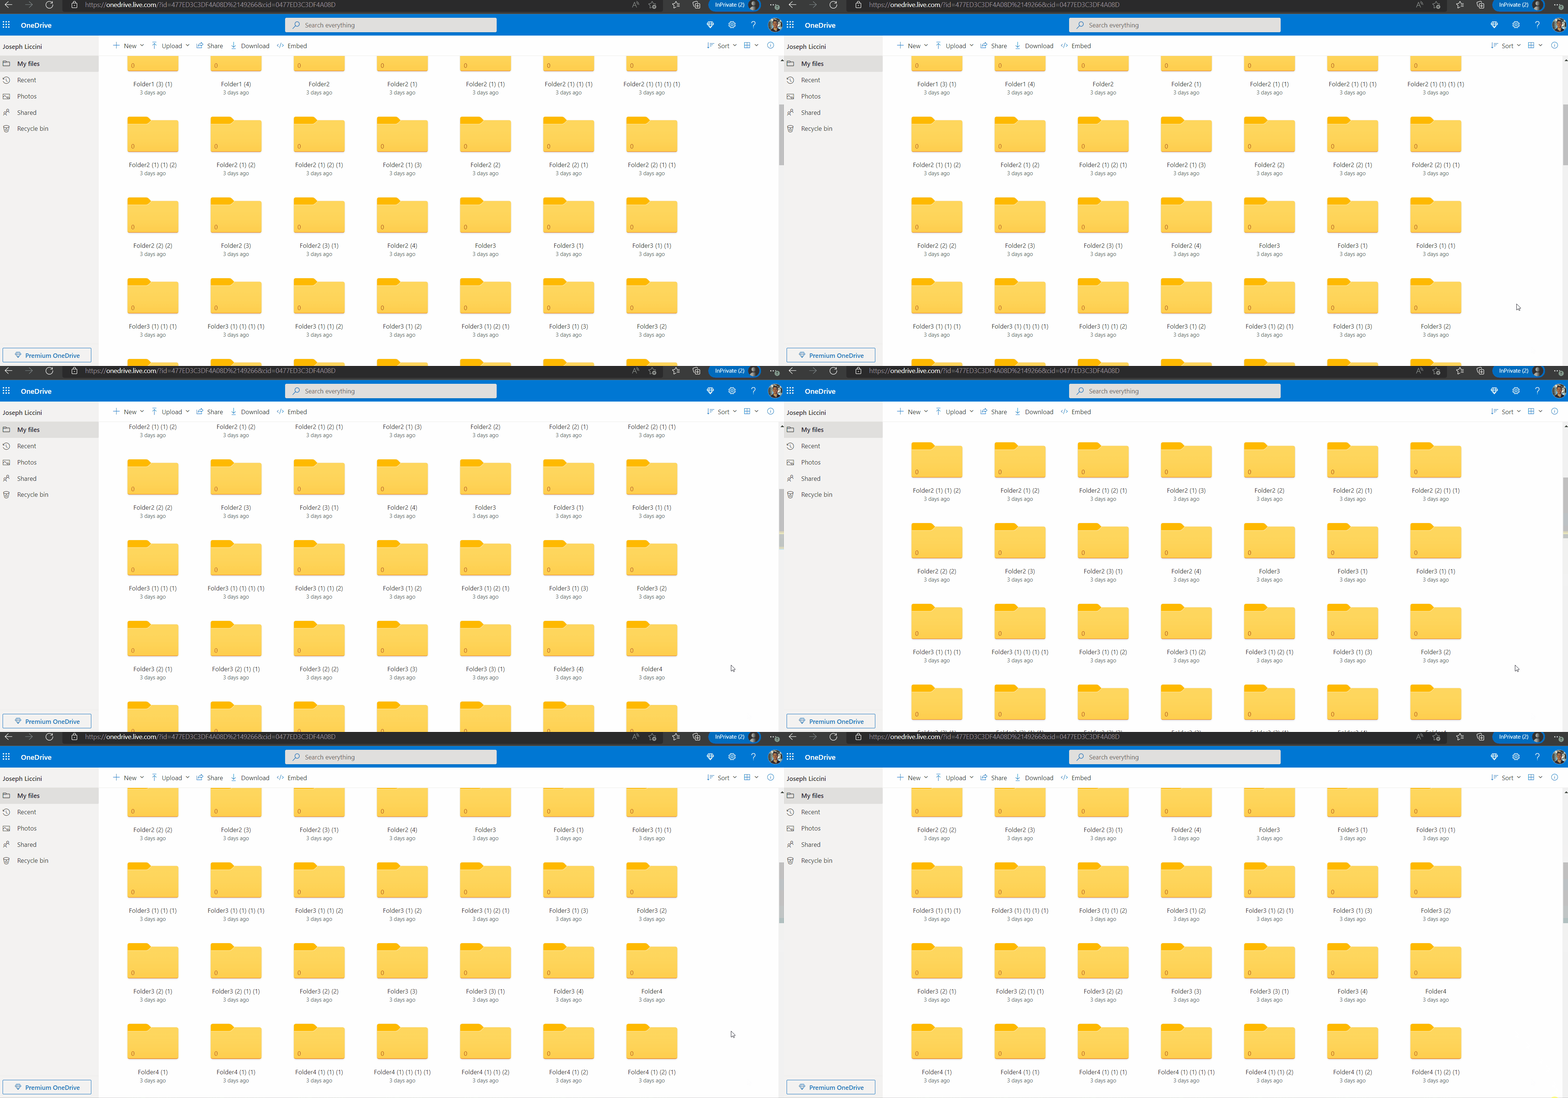
If this was occurring on my modern, high performance hardware, then it must be abysmally choppy on low-to-mid performance typical user hardware!
I decided to investigate a bit more closely, and I landed on a one-line change that eliminated all choppiness while scrolling and restored a buttery smooth scroll experience.
Collecting a Trace
When I am able to reproduce a performance issue, the first thing I do is collect a performance trace. I've collected a trace reproducing the issue here if you want to load it up yourself.
With the trace collected, I began analysis in the Chromium Profiler.
Initial Observations
There are a few observations that initially stood out to me:
Dropped Frames
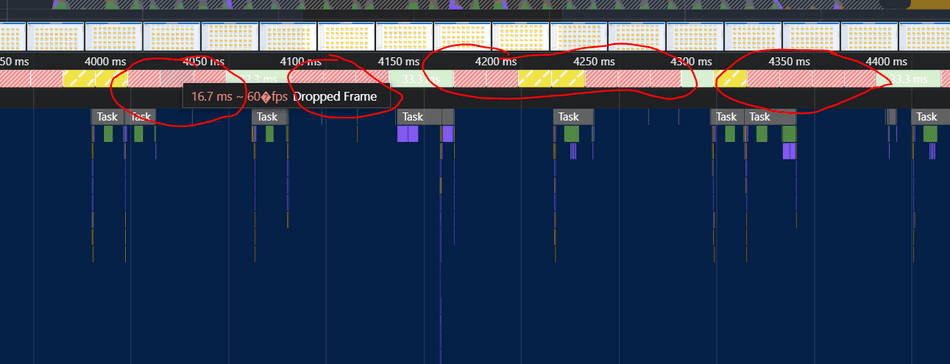
When choppiness is visually observed, it is internally attributed to Dropped Frames. Frames are the objects produced by the browser to update the display with pixels.
For an animation or visual update to appear smooth on a typical display, these frames must be produced at a consistent 60 Frames per Second (FPS).
When a Frame is unable to be produced on time to achieve this rate by the browser, that frame is called a Dropped Frame.
In the Profiler, I observe a high frequency set of Dropped Frames while scrolling through the OneDrive Files list:
Minimal Main Thread Activity
Often, Dropped Frames arise from heavy compute on the Web Application process Main Thread (often from Long Tasks).
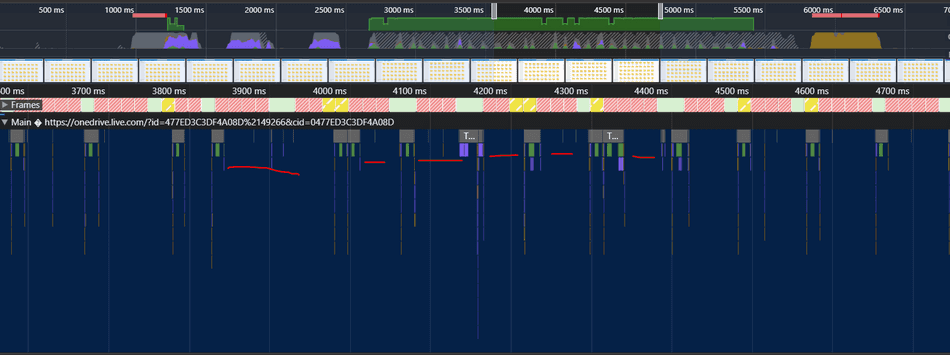
In this case, however, the activity on the Main Thread is minimal, indicating that the typically observed heavy JavaScript Tasks are not to blame!
I can observe minimal Main Thread activity in the Profiler UX due to the gaps, as highlighted below:
GPU Activity
Once I ruled out heavy Main Thread activity as the root cause of the choppy scrolling, I worked my way down though the Chromium Profiler's UX to see if I could find any other activity in the system that could be contributing to the dropped frames.
What I discovered was heavy GPU Tasks that were occurring at the same time as the dropped frames:
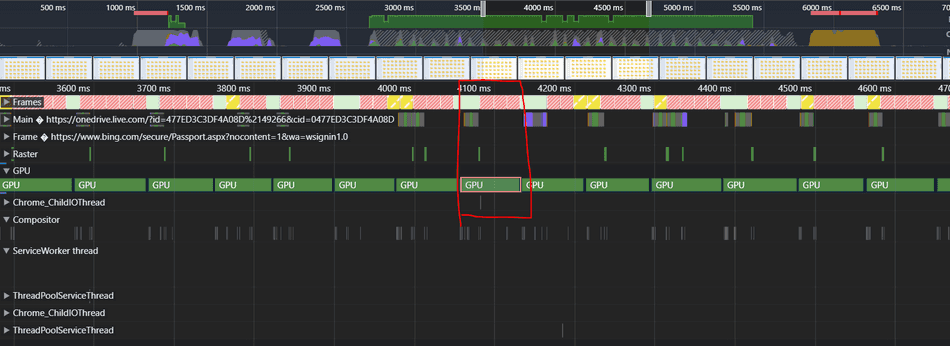
This seemed very suspicious, so I decided to drill in to potential reasons for why the GPU would be doing so much compute while scrolling.
Scrolling in the Browser
Scrolling in the browser is driven through a specialized browser-internal construct called Layers.
Layers are spatially grouped visual elements that share a coordinate plane; these visuals are rendered and retained in GPU memory.
The browser can apply fast and lightweight graphical transformations (such as CSS Animations or scrolling) using a dedicated thread, the Compositor Thread, with minimal computational overhead.
Layering enables the browser to perform fast graphics related transformations (such as clipping, rotation, translations) on in-memory rendered textures, rather than performing expensive or redundant drawing for each frame when preparing to update the user's display.
Specifically, scrolling is facilitated through translation of an in-memory Layer, and applying a clip operation to fit the scroll window:

Note: You can observe the Layers for your web application in the Chromium DevTools 3D View Tool.
For more in-depth details, see my tip on Layering and Compositing.
OneDrive Layering
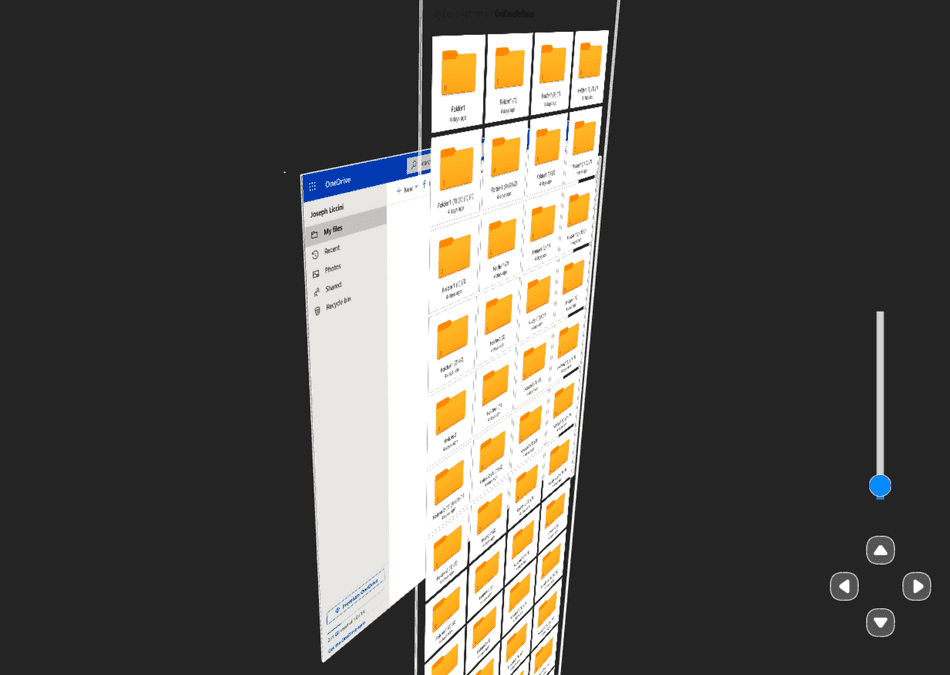
When I opened the 3D View for the OneDrive application, I noticed that the browser did not create a dedicated Layer for the scroll area:

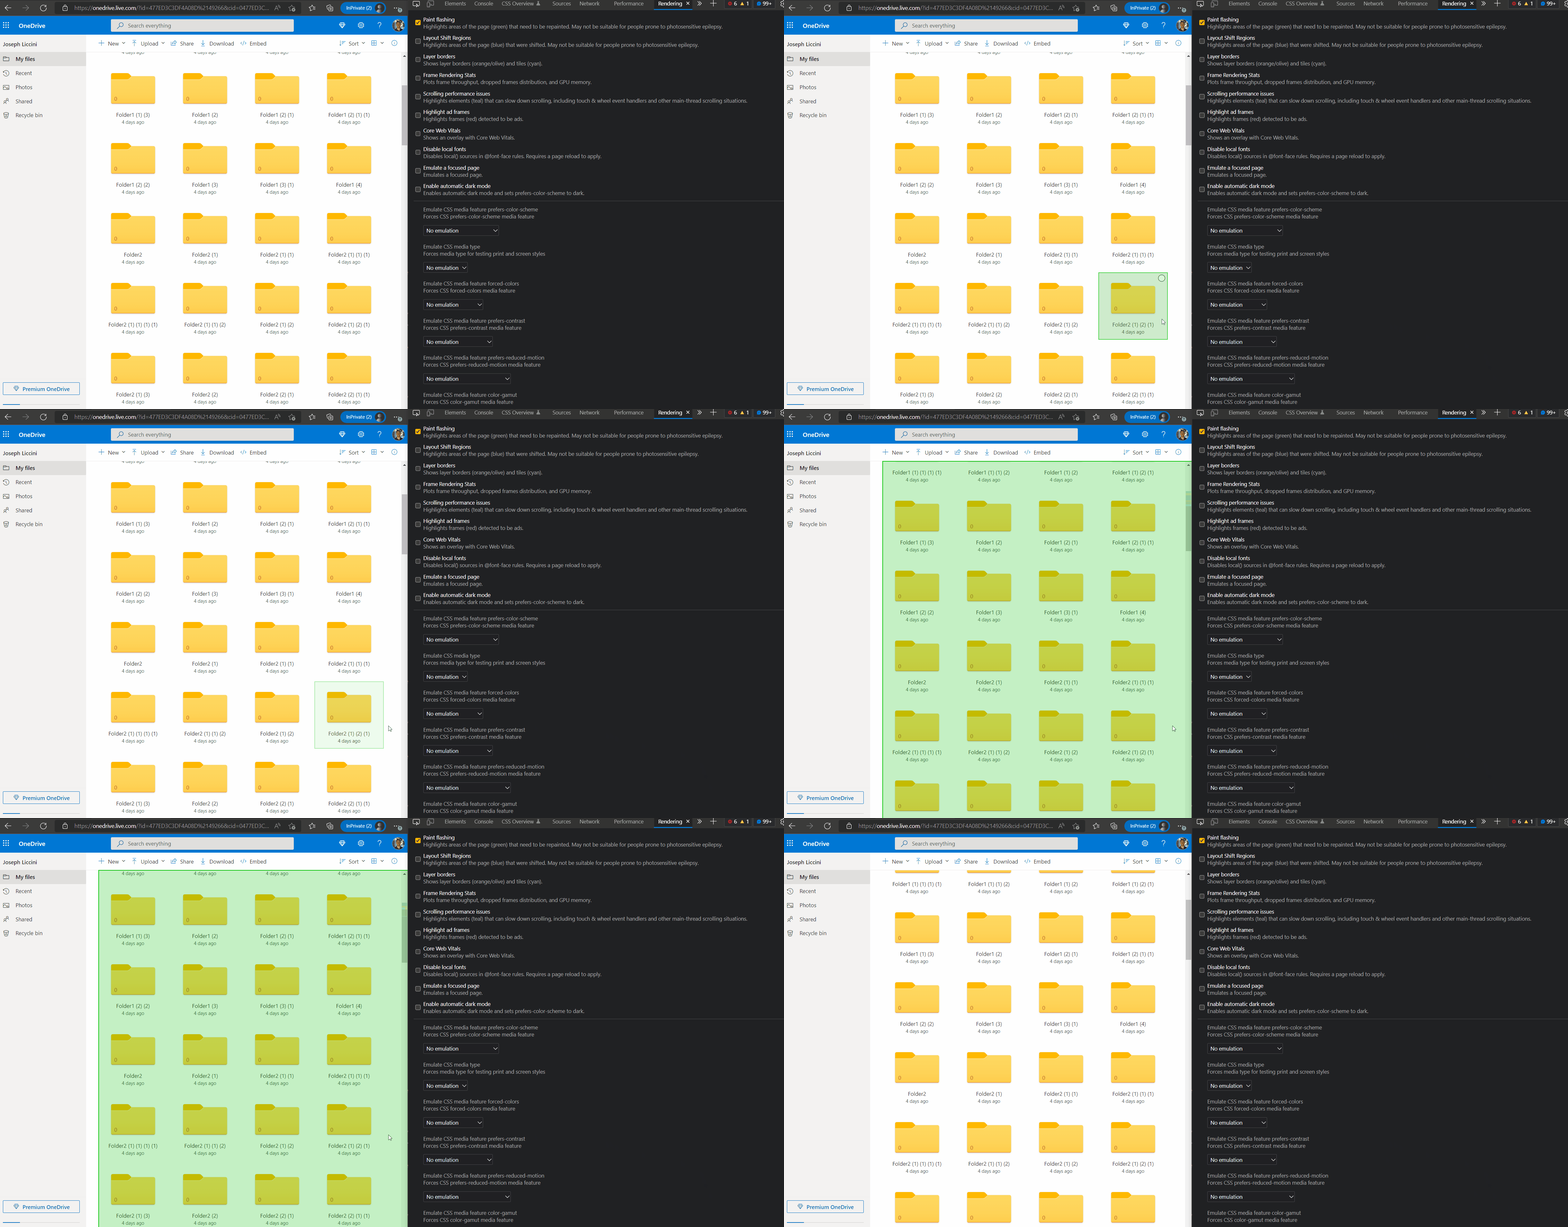
I also observed that every time I scrolled in the UX, the Paint Count would increase on every scroll I applied in the UX. I further confirmed this by using the F12 DevTools Rendering UX and enabling Paint Flashing as I scrolled:
Root Cause
Layer Re-drawing on Scroll
It appears that the browser's default heuristics for the scroll element did not produce a Layer. This is likely due to
the scroll element being set to position: absolute (shown below).

Since the scroll region is not promoted to its own Layer, each scroll event is forcing the browser to re-draw the entire texture (as indicated by the Paint Flashing discussed earlier).
Graphical Compute Overhead from SVGs
I noticed that if the Scroll region contained many Folder Icons, it degraded quite quickly. Upon closer inspection, the Folder Icons are driven through SVG:
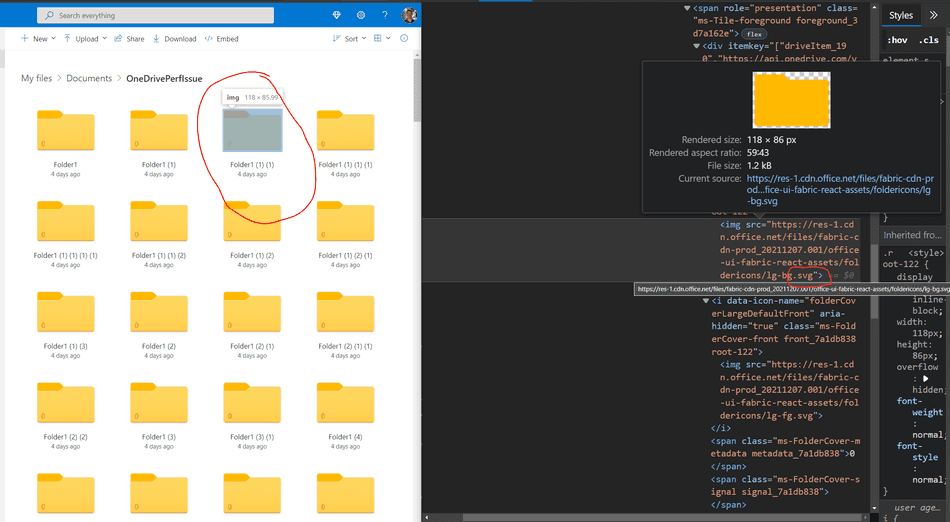
Since there are many SVGs on this UX (due to the number of Folder Icons), and each scroll event is forcing the browser to redraw each SVG, this is placing high frequency graphical computation on the device's GPU.
The Fix: A One Line Change
We can leverage the browser's Layering mechanism to pre-raster (draw) the entire texture in GPU memory. This would enable the following:
- The browser would only draw the SVGs once, and retain the texture in memory
- While scrolling, the browser can perform a cheap translation operation on the in-memory texture, rather than re-drawing the entire Layer
The following line of CSS can be applied to promote any collection of visual elements to a dedicated Layer:
will-change: transformWith this line of CSS applied to the scroll element, the following results are produced (the Folders list is in a dedicated Layer):
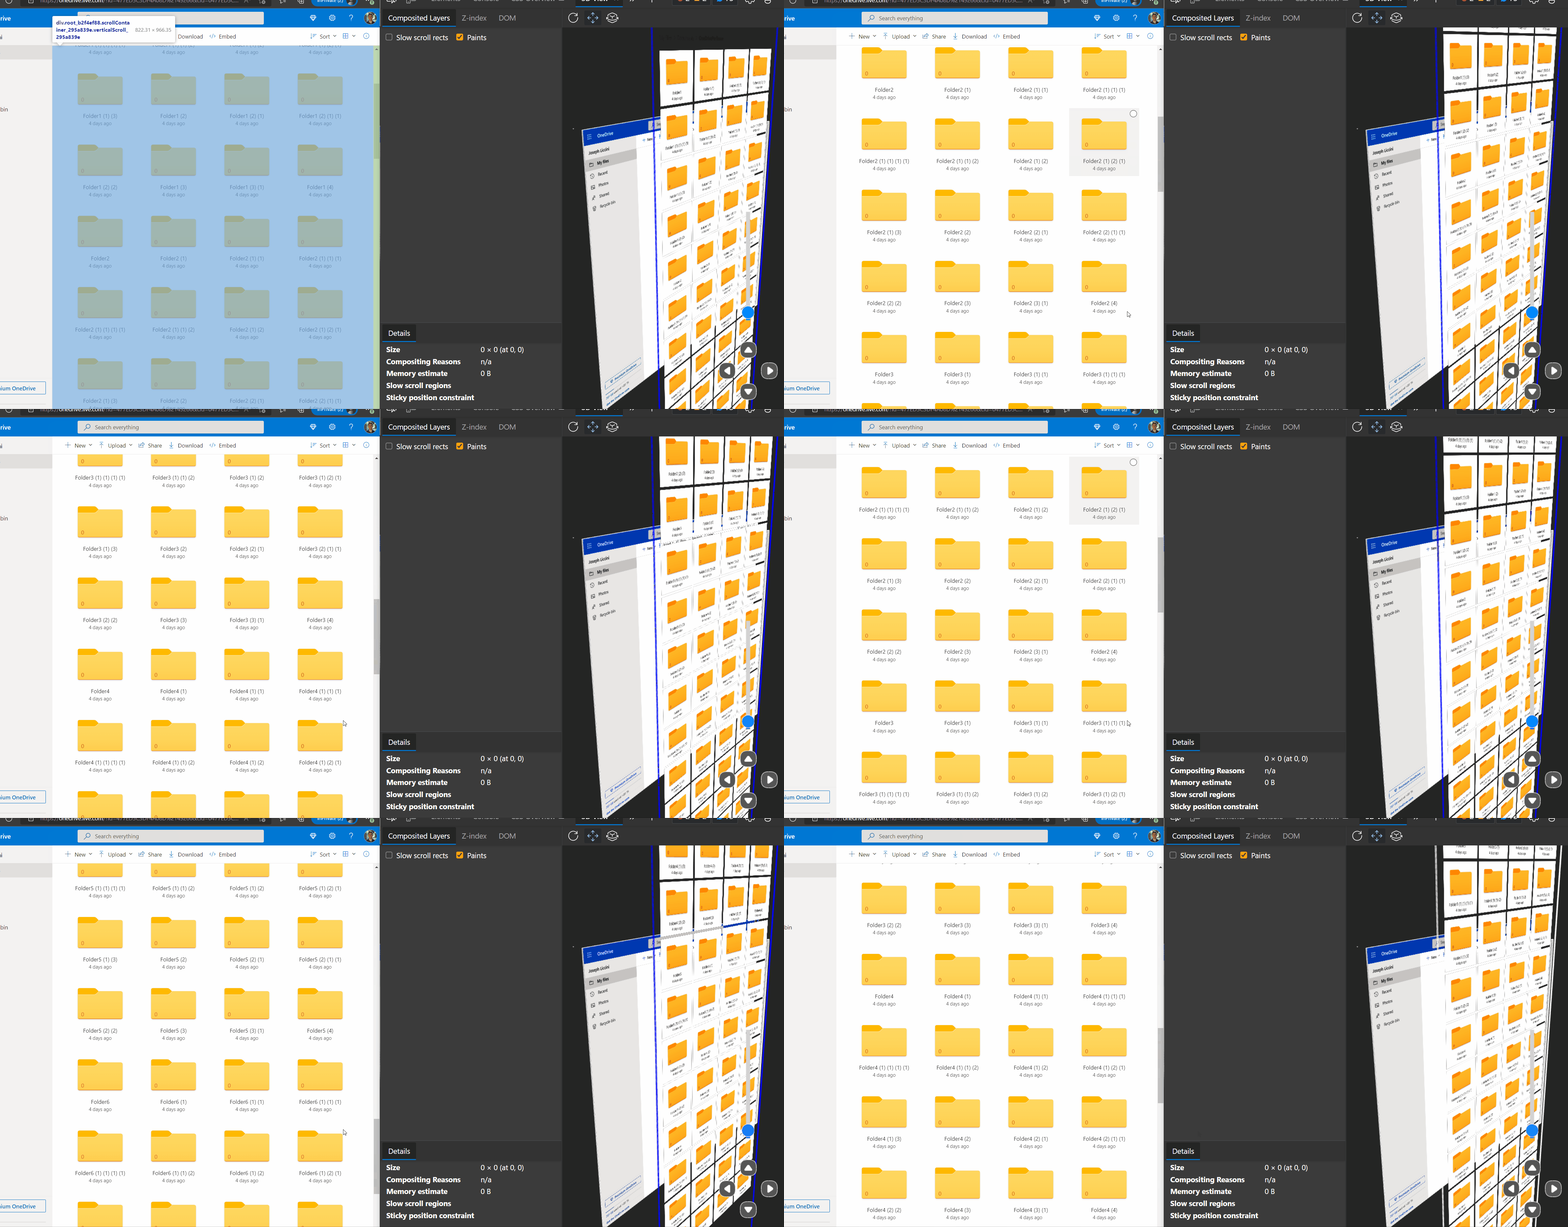
Visually, as I scroll in the UX, we can see the translation in the 3D View, and the scrolling is significantly more smooth (at a consistent 60 FPS):
Note: For browsers that don't support
will-change, you can usetransform: translateZ(0)and observe the same result.
Confirming in the Trace
After applying the fix, I collected another trace to confirm we successfully reduced the amount of Dropped Frames and compute on the device's GPU.
We can observe in the trace that as I scroll in the UX, the GPU is doing minimal compute, and the Frames are produced at a consistent 60 FPS:

Conclusion
Performance issues can arise from various components within the browser. It's important web developers understand the underlying browser primitives that drive the rendering pipeline.
Rendering at a consistent 60 FPS is a must in sensitive user-input scenarios (such as typing, scrolling, etc.) and one can leverage available APIs and patterns to ensure the system is consistently performing.
That's all for this tip! Thanks for reading! Discover more similar tips matching Browser Internals, Case Study, and CPU.

