HTML Parsing Inefficiencies on Uber Eats
Like many others throughout the pandemic, I used Uber Eats to safely deliver food while going to restaurants was unavailable.
One day, I decided to examine what the Uber Eats web application is doing at runtime, and I was surprised on what I found: inefficient, high frequency HTML parsing!
In this tip, we'll look at what Uber Eats is doing wrong and we'll discuss an optimization that can be applied to improve user experience.
Reference Traces
I have collected a trace of two scenarios which both manifest the same issue.
- A full page load trace of the Uber Eats home page.
- An in-app navigation trace of clicking on the Filter to Pizza button.
Both traces are available from here.
You can import these traces if you want to compare with my analysis yourself.
Identifying the Issue
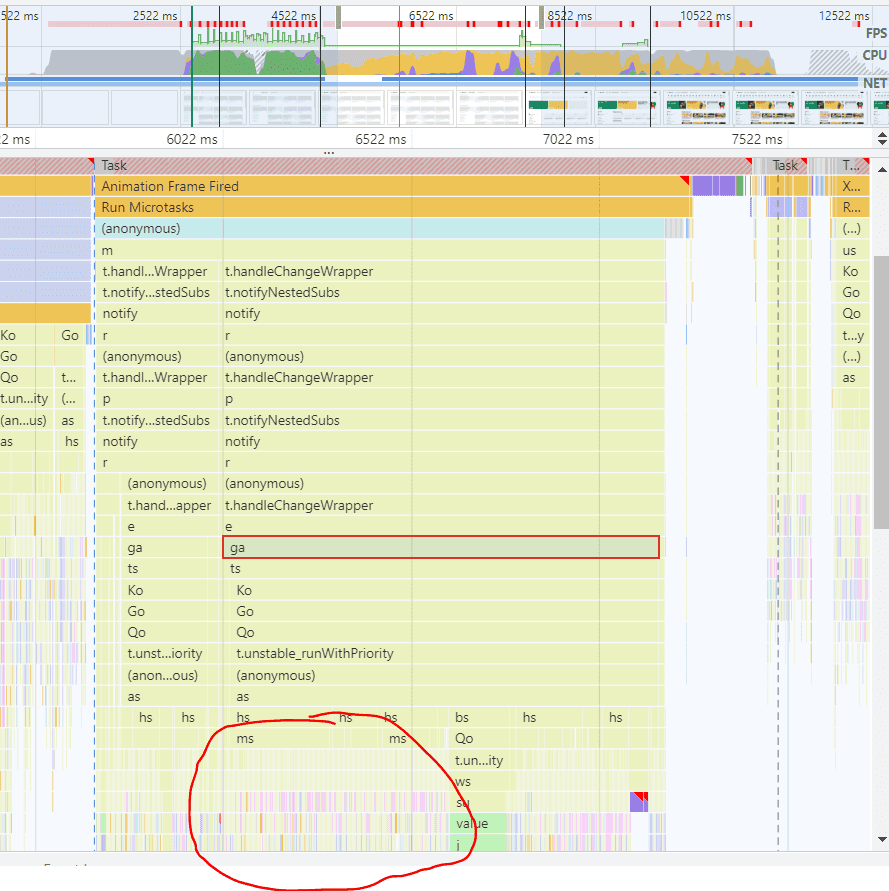
While the Uber Eats web app's CPU utilization is quite high leading up to the critical frame, the specific area that caught my attention was this section of the page load trace:

If you import the page load trace, the time slice to scope your profiler to would be 6072ms to 6622ms
I found this by exploring the long Animation Frame Fired task which is just before the critical frame generation:

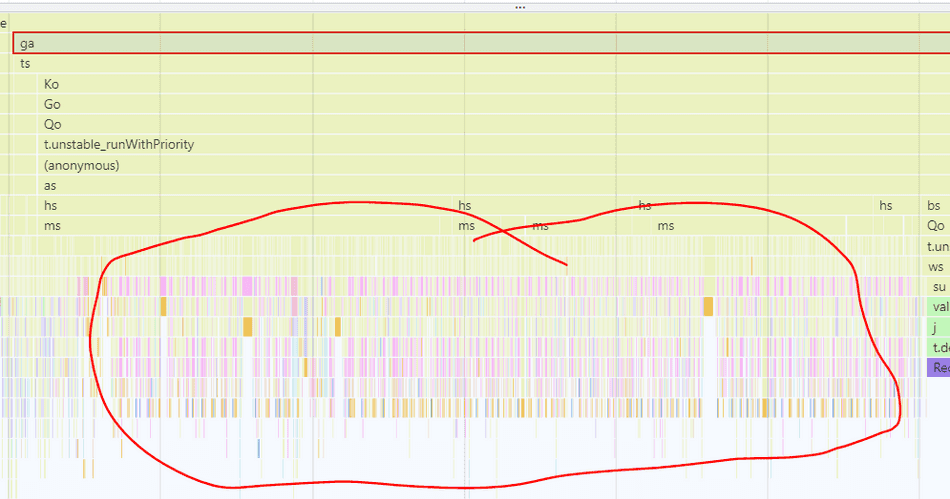
I used flamegraph shape knowledge to find the region of interest below:

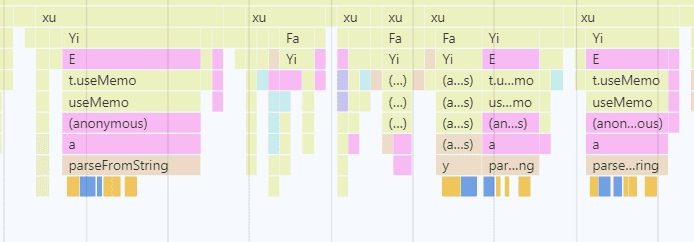
Within the spikes, we can see what's taking up time:

Note: In the in-app navigation (filter to Pizza) trace these same spikes appear around 5400ms to 5800ms.
Scoping to the Code
Once I found the spikes of interest, I utilized codepath scoping to see what the a function
is doing.
What I found is that it's invoking DOMParser.parseFromString API in high frequency:

Understanding the Code
While I don't have access to the Uber Eats source code, I can infer what their code is doing based on the minified sources and utilizing the Chromium Debugger to set breakpoints and logpoints.
What I found is that Uber Eats receives visual metadata from their backend and loads it as HTML strings to their frontend to render the cards on the Uber Eats UI.

For a standard page load, I see this codepath above invoked around 150 times.
The individual HTML strings are parsed into DOM nodes via parseFromString, which is a standard Browser API.
After a node is parsed, it's added to the DOM via appendChild.
The Problem
On the surface, this doesn't sound like anything CPU intensive:
- Receive HTML data from a backend
- Parse each entry to a DOM node
- Append each to the
documentvia JavaScript
The problem surfaces in how these HTML strings are parsed -- in particular the frequency of invoking parseFromString.
The browser excels at parsing HTML, so why is this case slow?
DOMParser
DOMParser.parseFromString(string, 'text/html') is quite powerful.
It creates a fully structured document object with all HTMLElement nodes included in the tree.
A parsed document resides in-memory -- it's completely separate from the visual document the user is interfacing with.
Consider this snippet:
function parseToDom() {
    const node = '<span style="color:#545454"><img src="https://dkl8of78aprwd.cloudfront.net/ticket@3x.png" width="14" height="14" vertical-align="middle"/></span>';

    const domParser = new DOMParser();

    return domParser.parseFromString(node, 'text/html');
}

parseToDom();
Observe the fully structured document as output:

Performance Implications
Creating a fully-fledged in-memory document object isn't necessarily cheap, and this cost can add up when invoked in high frequency.
If we zoom into a spike in Uber's runtime trace, the profiler even shows the expensive document readystatechange Events
that are dispatched for each invocation of parseFromString:

By looking at this flamegraph, it's clear that parsing of the HTML (the Blue blocks) is
actually quite small (i.e. fast), but there's a lot of extra readystatechange events that are dispatched and are contributing
significant overhead.
In fact, the majority of each parseFromString's execution for Uber's small HTML text blocks are actually spent on dispatching
readystatechange events.
You can inspect Chromium DOMParser's source code and observe it creates a completely new Document. You can also observe the
readystatechangeevent dispatching in this class as well.
A proposed solution
As readystatechange events are dispatched for each parsed HTML document, frequently creating document objects will ultimately
lead to wasted work.
We can simulate what Uber's code is doing right now in a simple example:
const htmlTextStrings = [
    '<span style="color:#545454"><img src="https://dkl8of78aprwd.cloudfront.net/ticket@3x.png" width="14" height="14" vertical-align="middle"/></span>',
    '<span style="color:#545454"><img src="https://dkl8of78aprwd.cloudfront.net/ticket@3x.png" width="14" height="14" vertical-align="middle"/></span>',
    '<span style="color:#545454"><img src="https://dkl8of78aprwd.cloudfront.net/ticket@3x.png" width="14" height="14" vertical-align="middle"/></span>',
    // ... N number of nodes.
];

for (const htmlTextString of htmlTextStrings) {
    const parser = new DOMParser();

    // Creates a new document object (expensive and slow!)
    const parsedNode = parser.parseFromString(htmlTextString, 'text/html');

    // Do something with parsedNode...
}
Instead of creating a new document for each HTML text string to parse, I'd suggest joining all HTML text needed to parse into
a single HTML string, and then send that joined string to DOMParser.parseFromString.
const htmlTextStrings = [
    '<span style="color:#545454"><img src="https://dkl8of78aprwd.cloudfront.net/ticket@3x.png" width="14" height="14" vertical-align="middle"/></span>',
    '<span style="color:#545454"><img src="https://dkl8of78aprwd.cloudfront.net/ticket@3x.png" width="14" height="14" vertical-align="middle"/></span>',
    '<span style="color:#545454"><img src="https://dkl8of78aprwd.cloudfront.net/ticket@3x.png" width="14" height="14" vertical-align="middle"/></span>',
    // ... N number of nodes.
];

const htmlTextString = htmlTextStrings.join('');

const parser = new DOMParser();

// This only creates one document, and parses all HTML in one go (fast!)
const parsedHtmlDocument = parser.parseFromString(htmlTextString, 'text/html');

for (const parsedNode of parsedHtmlDocument.body.children) {
     // Do something with parsedNode
}
This approach avoids the multiple readystatechange Event dispatching and also avoids creation of extraneous document objects.
A Live Example
I've setup a live example of parsing 1000 HTML text strings using both approaches. You can check out the example here.
On my machine, using multiple calls to parseFromString results in about 338ms:

On the same machine, joining the HTML text strings, and using a single call to parseFromString on the joined string results in about 11ms:

Conclusion
The browser is quite efficient at parsing HTML, but creating document objects in high frequency to facilitate that parsing
can lead to performance bottlenecks.
Uber Eats could apply the techniques we've discussed and see a sizeable improvement in their time to generate their critical frame!
Consider these tips:
That's all for this tip! Thanks for reading! Discover more similar tips matching Case Study, CPU, and JS Optimization.

