Identifying Common Network Bottlenecks
In this tip, we'll look at common network bottlenecks, how they manifest in Chromium Profiler, Network Tab, and how you can quantify them in your own web application!
Prerequisites
You should be familiar with:
Network Request Lifecycle
Each network request, whether it's the initial HTML document navigation request or a JavaScript subresource is subjected to the same phases of loading over the network:

These phases have corresponding timestamps, also pictured in the diagram by the arrows.
I specifically will not be talking about Redirects or the deprecated App Cache phase in this tip, so we'll examine our requests' lifecycle phases of DNS, TCP, Request and Response:

In the diagram above, the labeled arrows (i.e. connectStart, connectEnd, etc.) represent timestamps that mark the start
or end of the request lifecycle phase. The rectangular blocks represent the duration attributed to each phase (i.e. TCP).
Resource Timings
The browser conveniently logs the timestamps (in milliseconds) for each phase of our network requests. These timestamps are known as Resource Timings, and you can access each timestamp by using the following APIs:
// Quantify the timing of the initial navigation request (initial document)
const navigationTiming = window.performance.getEntriesByType('navigation')[0];

// Quantify the timing of each subresource (JS, CSS, Image, etc.)
const subresourceTimings = window.performance.getEntriesByType('resource');
The shape of the object returned will resemble the following (I've hidden some properties for simplicity):
{
    // DNS
    domainLookupStart: 2,
    domainLookupEnd: 4,

    // TCP
    connectStart: 4,
    connectEnd: 8,

    // Request + Response Transfer
    requestStart: 8,
    responseStart: 900,
    responseEnd: 1000,

    // Request Type
    entryType: "navigation",
    name: "https://www.wikipedia.org",

    // Navigation Requests always start at 0
    // Subresources (JS, Images, etc.) will not
    startTime: 0
}
These timings are quite handy for us to connect into telemetry systems and to create user-representative performance dashboards.
If we look at the above request entry we can attribute the following time to each phase:
- DNS:
domainLookupEnd-domainLookupEnd= 4 - 2 = 2 milliseconds - TCP:
connectEnd-connectStart= 8 - 4 = 4 milliseconds - Request Sent, Waiting for Response:
responseStart-requestStart= 900 - 8 = 892 milliseconds - Response Transferring:
responseEnd-responseStart= 1000 - 900 = 100 milliseconds
From computing time for each phase, we can clearly see the bottleneck here is the Request Sent, Waiting for Response phase.
The Chromium DevTools utilize these timings to help us visually identify bottlenecks.
Box Diagrams
If we mapped these quantities to scale in a simple box diagram, it would look like this:

By plotting the timestamps visually, it becomes even more apparent that there's a bottleneck in the Request Sent, Waiting for Response phase.
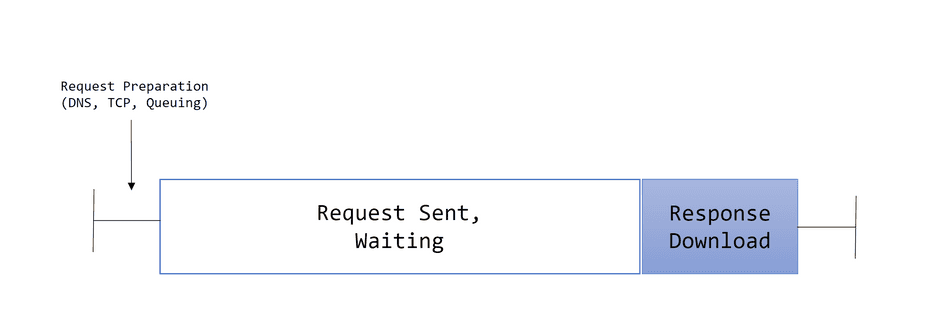
In the Chromium F12 Profiler's network pane, the tool will combine the DNS, TCP, and other request-preparation phases, and group that into Request Preparation time. The Profiler also will colorize the Waiting for Response time in a lighter color, indicating no bytes are transferring during that time:

An example of this, captured in our profiler trace would look like this:

Waterfall Diagrams
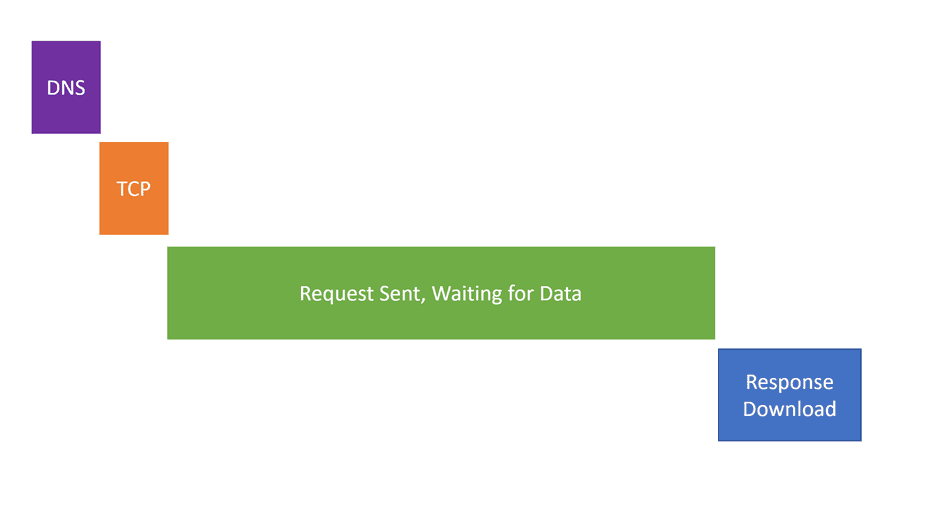
Another way to visualize the lifecycle of a request is to use a waterfall diagram. If we represented our above resourcing timing as a a waterfall, it would look like this:

We can view the waterfall for each request by selecting the Request in the Network tab, and then the Timing tab:

Common Bottleneck 1: Long Waiting Time
One of the most common bottlenecks I see follows the theme we've been describing so far in this tip -- a request dispatched is often waiting for the backend to reply with the payload for an extended amount of time.
This will manifest as a long Request Sent, Waiting for Response time. Visually, it'll look like this in the profiler:

Its waterfall diagram will look like this (similar to what we've seen so far):

In your Resource Timings, you would see a sizeable time gap between requestStart and responseStart.
This will manifest most often in cases of:
- A slow backend -- it's taking an extended period of time to produce a response back to the client
- A distant backend -- it's taking a long time to reach the backend and/or be notified of the backend's response
Common Bottleneck 2: Long Download Time
Another common network request shape I see is an inverse of the one we've described. In some cases, the target backend is fast at returning a response, but the payload is large, and takes considerable time to download.
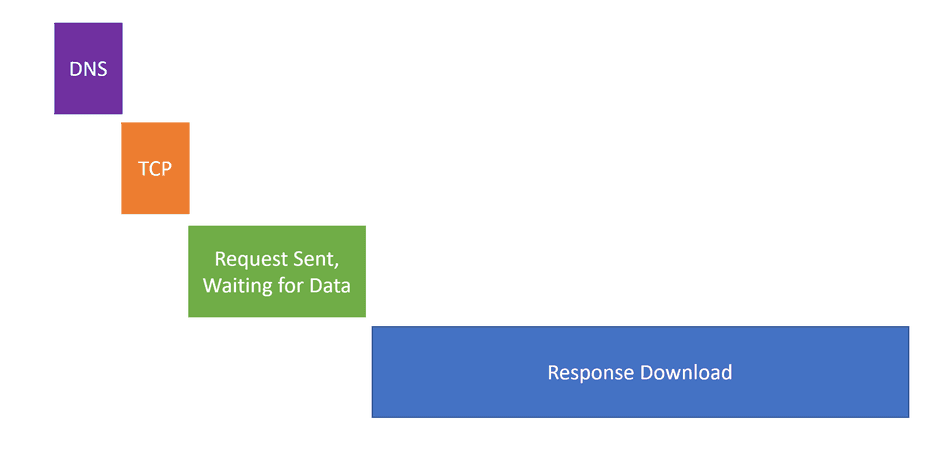
This will manifest commonly as a short or moderate Request Sent, Waiting for Download time, and a long Response Download time:

Its waterfall diagram will resemble this:

In your Resource Timings, you will see a sizeable time gap between responseStart and responseEnd.
This will manifest often in the case of a CDN, which are fast at responding to client requests, but often transfer large payloads (i.e. large images or JavaScript files).
Response Download time is directly impacted by a resource's Transfer Size, so you should ensure it's optimized for delivery.
Conclusion
Using the browser's Resource Timings and DevTools visualizations can help us identify Networking inefficiencies in user and local sessions.
Make sure to use these tools to make informed decisions about optimizing your web application's network dependencies!
That's all for this tip! Thanks for reading! Discover more similar tips matching Measuring and Network.

