Why Your Cached JavaScript Is Still Slow and Incurs Performance Overhead
Web Developers often fixate on optimizing the delivery of assets to the end-user's device, and overlook the computation that takes place on the end-user's device once those assets arrive.
In modern web development, JavaScript-centric SPAs are flooding the user's device with heavy compute. When I meet with teams interested in improving their web product's performance, this concept of client-side compute is often overlooked and I'm met with the following common misconceptions:
- Our JavaScript is Cached in the Browser, so our page should be fast!
- Bundle size doesn't matter since the bundles are stored in cache!
- We just completed our React migration, so we were expecting sizeable performance improvements, especially when the JS is cached!
These couldn't be further from the truth!
The Important of Asset Delivery
Don't get me wrong, for optimal web performance, assets should be optimally delivered and cached!
Web application performance is fundamentally tied to the network and the speed at which we can deliver an asset to the end-user device.
However, even if a web application has all assets optimally delivered and/or cached, that doesn't mean that it will run fast or render quickly when it is needed during runtime on the end-user's device.
Web Application Bottlenecks
At a high level, there are two primary performance bottlenecks on the web:
- Networking - the round-trip time to acquire an asset or data payload from a remote server
- End-user Device Compute - the amount of computational overhead required on the end-user's device
The latter often overlooked, and nowadays, it's the most important aspect of web performance! When JavaScript is cached, there is no networking cost! However, there is plenty of end-user device compute cost.
Let's take a closer look at the (significant) compute associated with loading and executing cached JavaScript.
A Concrete Scenario
Consider the following React-based SPA:
<body>
    <div id="root"></div>
    <script src="/vendor-bundle.HASH.js" type="text/javascript"></script>
    <script src="/app-bundle.HASH.js" type="text/javascript"></script>
</body>
// app-bundle.HASH.js
ReactDOM.render(<MyApp />, document.getElementById('root'))A common and insightful optimization would be to apply Cache-Control
headers to the app-bundle and vendor-bundle JS files. One might even go further and use a Service Worker to
pre-install assets.
This would allow users who re-visit the web application to load the JavaScript files from an offline disk cache.
But what happens when these JavaScript files are loaded from cache?
System Overview
The following diagram overviews the process of loading a script from disk cache:
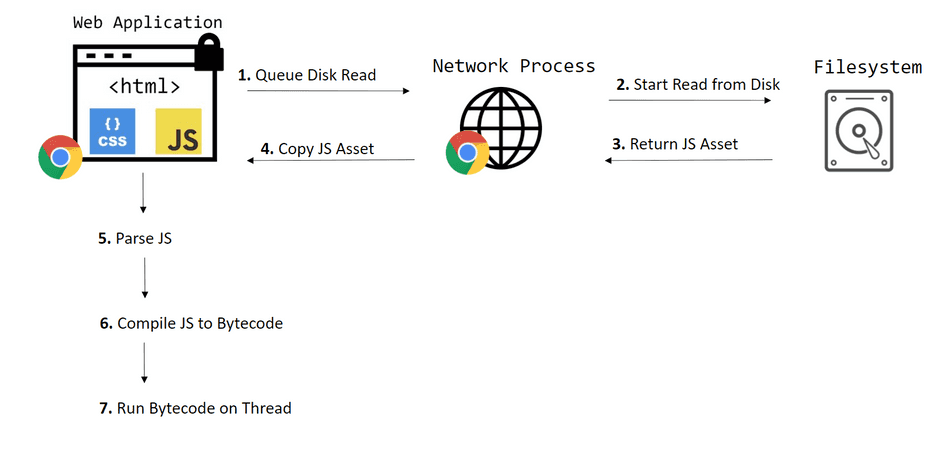
Let's consider some of the various bottlenecks that arise here.
IPC Cost
Inter-Process Communication (IPC) is how processes in the browser send messages between each other.
Browser cache stores cached files on the end-user's device on disk. Disk access is not granted to the process executing your web application and is performed by the dedicated Network process, which loads cached assets from disk for all tabs and windows across the browser.
The process running the Web Application sends an IPC message to a dedicated Network process to load an asset. The asset is loaded from disk by the Network process and transferred back to the Web Application process via an IPC message.
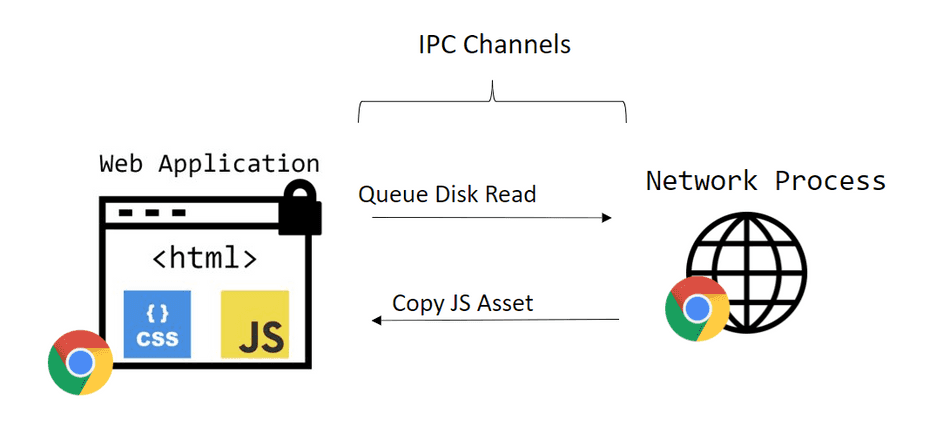
IPC messages are not instantaneous. Furthermore, a large asset will require more time to fully transfer across the IPC channels.
The asset size will have a direct impact on how long this IPC transfer takes, and text compression like GZip or Brotli will not help mitigate this cost!
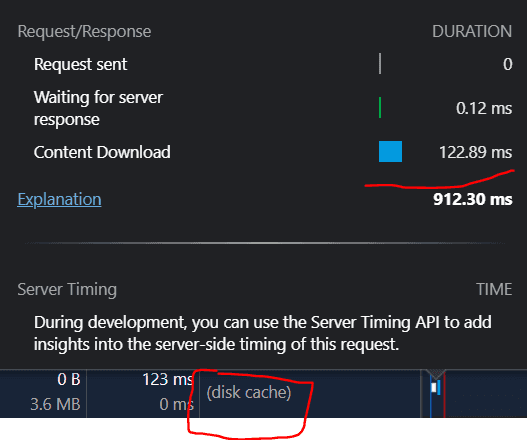
In the Chromium Network Tab, you may see a sizeable Content Download time associated with large scripts, even if they are loaded from the browser cache. This indicates IPC overhead:
Disk Cost
Disk access performed by the Network process is not instantaneous.
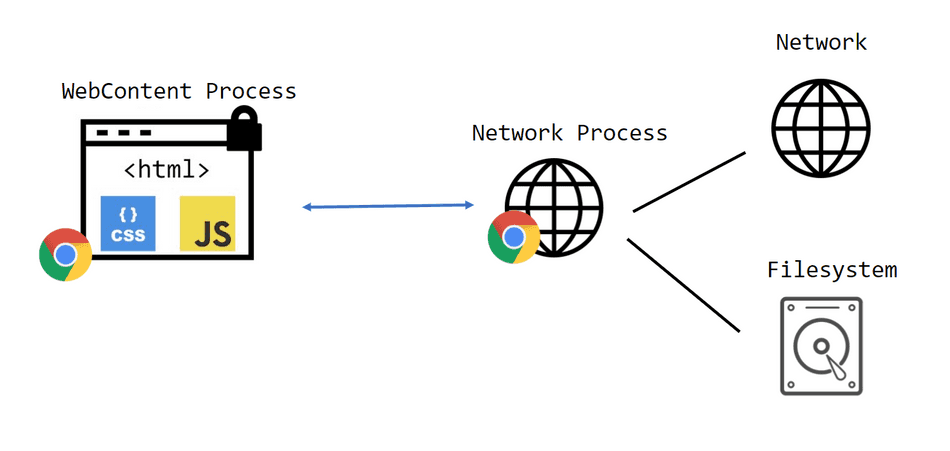
For some users, this disk access may be extremely slow. Many users are still using physical spinning hard drives, or have a disk that's under intense load (i.e. running an antivirus scan or at storage capacity).
Furthermore, high-frequency disk reads (i.e. trying to load many cached scripts from Browser Cache at once) can cause backup on the Network process's Thread and Event Loop, and incur queueing time:
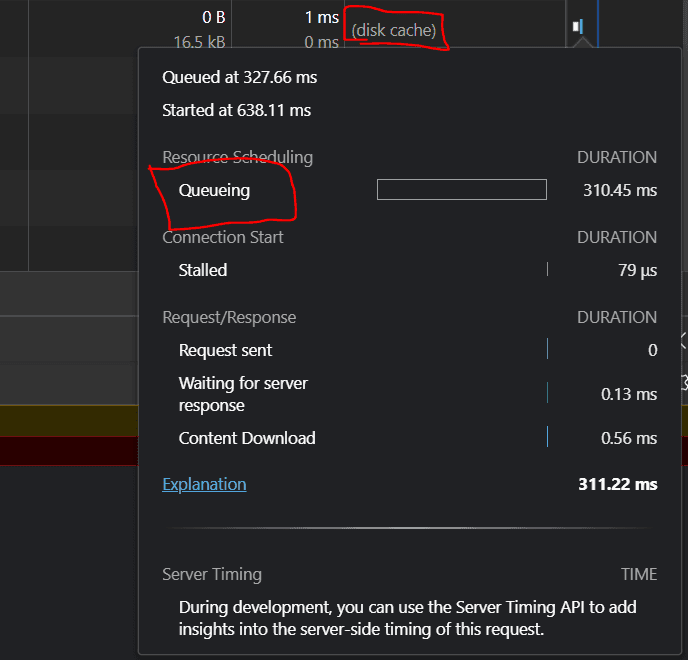
In addition, a large asset will take longer to read from disk, and text compression like GZip and Brotli will not help mitigate this cost.
Parse and Compilation Cost
Once an asset has been read off disk and copied back to the Web Application process, its journey is not over!
JavaScript is loaded as text, and it now needs to be converted to instructions for the engine to begin executing it.
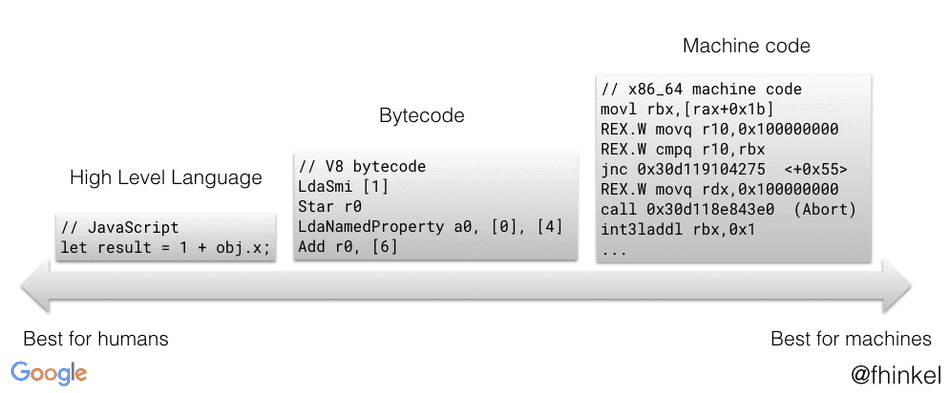
The above image is from Franziska Hinkelmann's blog.
At a high-level, this process works like this:
- Parse the JS text into an Abstract Syntax Tree
- Traverse the Abstract Syntax Tree, and emit Bytecode
- Load the Bytecode onto the thread, and begin execution of the script
All of this work requires end-user device compute, and it's not a particularly efficient process for the browser to perform. In general, the larger the JavaScript file, the longer it will take to complete Parse and Compilation.
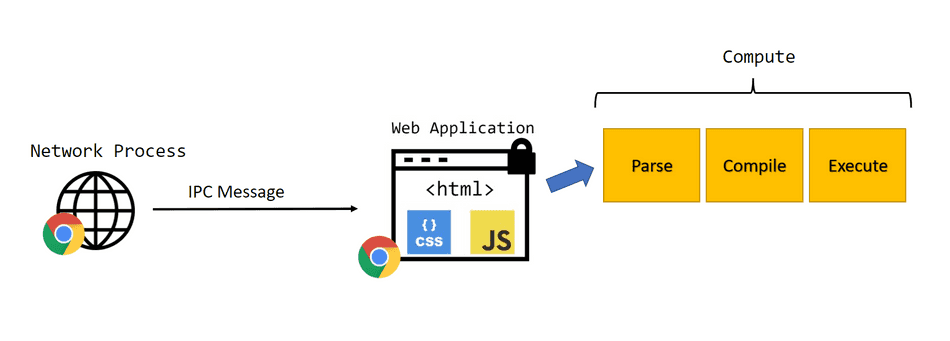
Browsers will apply various optimizations in this phase, such as deferred parse and compilation and moving portions of this work to dedicated threads to help parallelize. But despite best efforts from the browser, this cost is still significant.
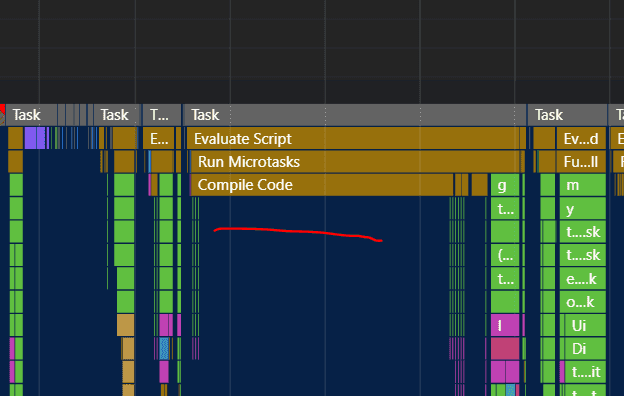
In a performance trace, one can observe this cost across the Main Thread and other threads:
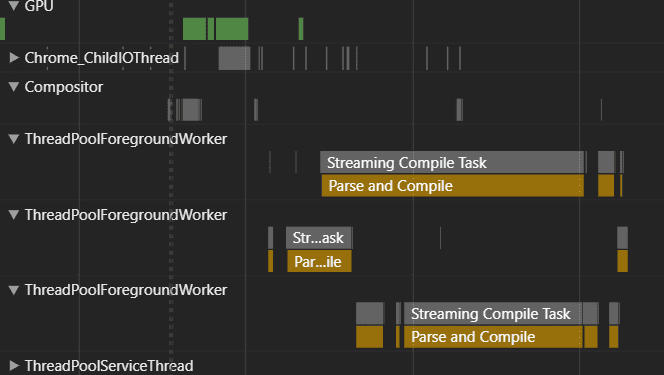
A compilation block on the Main Thread:
Bytecode Caching
A savvy web performance engineer might have discovered that the browser performs heuristic-based bytecode caching.
Despite bytecode caching being a powerful optimization performed by the browser, it does not fully eliminate the bytecode cost associated with JavaScript.
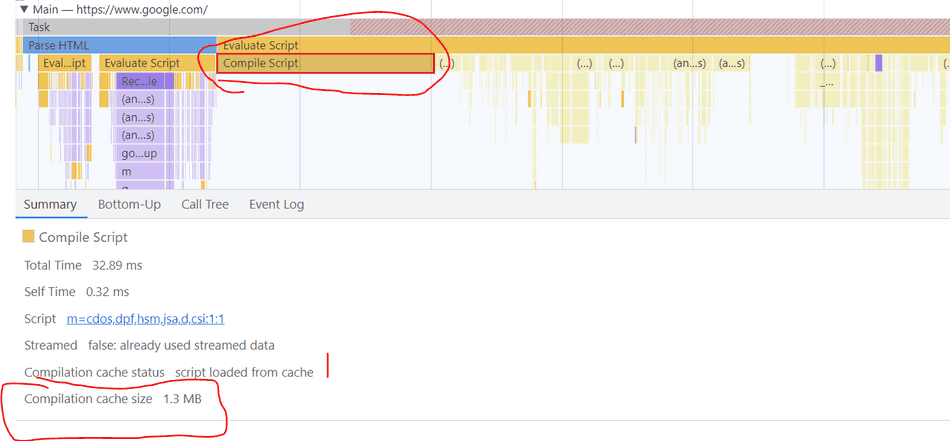
Generated bytecode is generally much larger than the text of the source JavaScript. As a result, it takes much longer to read the sizeable amount of cached bytecode off disk and onto the thread. In general, larger source JavaScript files produce larger generated bytecode, that takes longer to load off disk and onto the thread.
You can see the compilation cache size in the Profiler:
Furthermore, not all bytecode caching techniques optimize in the same way. For example, in Chromium, scripts cached
during the Service Worker 'install' event generate a more comprehensive instruction set, but often produce a larger
size. This reduces runtime codegen, but incurs more overhead during initial code load.
Script Execution
Once the script finally has its initial bytecode generated and loaded onto the thread, the browser can begin execution.
Execution cost will vary depending on the operations being performed by the script. Generally, most web applications I spend time profiling do a combination of JavaScript business logic and React-based DOM operations. The performance of these operations are not tied to the size of the script, but the amount of compute and efficiency of the executed codepaths.
In general, DOM operations performed through JavaScript are significantly slower than using static HTML, and JavaScript execution doesn't perform well on low-end devices.
You can use performance timing marks and measures to capture and measure the speed of the codepaths in your critical path.
Deferred Compilation
In most cases, your script still has more bytecode to produce when it executes!
In order to bootstrap your web application as soon as possible, JavaScript engines try to parse and compile the least amount of code required to run your script.
What happens, however, is that as your script starts execution, the engine discovers previously skipped codepaths that need to be compiled, and this cost is often still observed, even if a script is loaded from cache.
In the profiler, you'll observe the following:

These deferred compilation blocks will interleave with your executing JavaScript, adding additional overhead to your web application's critical path.
Conclusion
In this tip, we discussed the overhead associated with loading JavaScript, even if it's loaded from Browser Cache.
Caching assets is a fantastic way to optimize the network overhead of your web application, there is still plenty of computational overhead associated with cached JavaScript.
I recommend continuous measuring and profiling to identify this overhead. Consider techniques that utilize static HTML and CSS, rather than runtime client JavaScript compute. Aggressively reduce the size of JavaScript bundles to minimize client computational overhead. Analyze and measure codepath efficiency of required JavaScript to minimize the total amount of client compute and allow the browser to present frames efficiently.
That's all for this tip! Thanks for reading! Discover more similar tips matching Browser Internals, JS Optimization, and Profiler.

